
An order book heatmap shows where size rests in the book and how long it stays. Bright rows are large resting orders, often called walls. It shows orders resting now, not projected forced-liquidation price levels, which are estimated from open positions. This guide builds one for BTC on Hyperliquid, an onchain crypto exchange: live from Hyperliquid's own feed, then from history at one column per second. It then measures how long walls last and looks up the addresses that placed them. Every request ran on 8 November 2026, and every output is what came back.
Short answer
- Live: Hyperliquid's free
l2BookWebSocket sends 20 price levels a side, about every 5 seconds. Those 20 levels covered a median $40 of a $76,000 BTC price. - History:
GET /v1/hyperliquid/orderbook/{symbol}/historyreturned three hours of BTC books at half-second spacing, 23,598 snapshots, in 24 requests and 7 seconds. Hyperliquid's own API keeps no book history. Its archive is monthly requester-pays S3 files, not a query by time, and Hyperliquid does not guarantee they are complete or on time. - Walls are brief: of 1,334 BTC walls of 25 BTC or more in those three hours, the median lasted 1 second and the longest 29 seconds.
- Owners are visible: the L4 book lists every resting order with its address. In each of the three longest-lived pulled walls, two addresses each held a 13.2 BTC post-only sell, together 80 to 84% of the level, and one of them appears in all three.
Why build this on Hyperliquid
Most venues publish an aggregated book: a price, a size and maybe an order count. Hyperliquid records every order onchain with the account that placed it. 0xArchive serves that as an L4 book from 11 March 2026, so a heatmap here can answer what an aggregated book cannot: is this wall one trader, or fifty?
What you need
- Python 3 with
requestsandwebsockets. The snippets are short prototypes with no retry logic. - A 0xArchive API key in
OXARCHIVE_API_KEY. Hyperliquid's own API needs no key. The Free plan covers the last 30 days. See pricing.
Step 1: a live heatmap from Hyperliquid's feed
Subscribe to l2Book on Hyperliquid's WebSocket. Every message is a full 20-level snapshot with its own timestamp, so each message becomes one column of the heatmap. Place columns by that timestamp, not by a fixed step: messages do not arrive evenly. After a reconnect, start again from the next full snapshot.
import asyncio, json, websockets

async def main():
    async with websockets.connect("wss://api.hyperliquid.xyz/ws") as ws:
        await ws.send(json.dumps({"method": "subscribe",
                                  "subscription": {"type": "l2Book", "coin": "BTC"}}))
        seen = 0
        while seen < 3:
            msg = json.loads(await ws.recv())
            if msg.get("channel") != "l2Book":
                continue
            seen += 1
            bids, asks = msg["data"]["levels"]
            print(msg["data"]["time"], len(bids), len(asks), bids[0], asks[0])

asyncio.run(main())
Output at 16:20 UTC on 8 November 2026:
1794154809227 20 20 {'px': '76014.0', 'sz': '0.37033', 'n': 4} {'px': '76015.0', 'sz': '9.53366', 'n': 47}
1794154811404 20 20 {'px': '76014.0', 'sz': '0.80599', 'n': 5} {'px': '76015.0', 'sz': '9.53318', 'n': 47}
1794154816871 20 20 {'px': '76014.0', 'sz': '1.80797', 'n': 8} {'px': '76015.0', 'sz': '9.0849', 'n': 44}
A 120-second recording returned 24 messages. Plot price as dollars from the mid, one row per $1, one column per message, and colour each cell by resting size on a log scale:
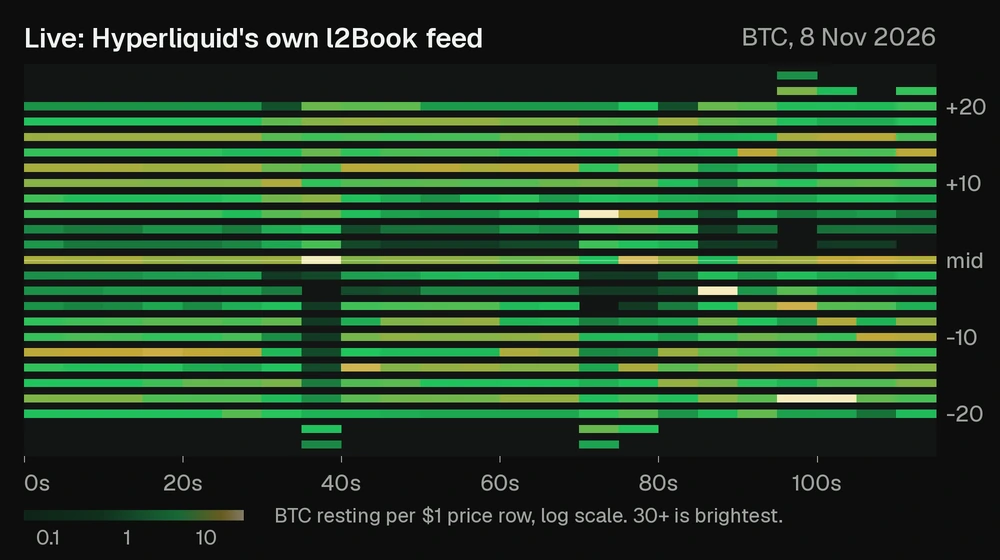
l2Book, BTC, 8 Nov 2026. One column per message, about 5 seconds each.Two limits show at once. The feed has no past: the chart starts when your script starts. And it is narrow. The 20 levels a side spanned a median $40, about 5 basis points, so the rows past 20 dollars from the mid are nearly empty. A wall 20 basis points away never appears. Hyperliquid's own partial fix is the nSigFigs option on l2Book: ask for 2 to 5 significant figures and each of the 20 levels becomes a wider price bucket, so you see further from the mid at a coarser grain.
Step 2: the same heatmap from history
0xArchive stores the same 20-level book from 15 April 2023, about two snapshots a second. /orderbook/{symbol}/history returns 1,000 snapshots a page:
import os, requests

H = {"X-API-Key": os.environ["OXARCHIVE_API_KEY"]}
url = "https://api.0xarchive.io/v1/hyperliquid/orderbook/BTC/history"
# 6 Nov 2026, 12:00 to 12:10 UTC
r = requests.get(url, headers=H, params={"start": 1793966400000, "end": 1793967000000, "limit": 1000}).json()
rows = r["data"]
print("rows", len(rows), "has_more", r["meta"]["has_more"])
first = rows[0]
print(first["timestamp"], len(first["bids"]), len(first["asks"]))
print("best bid", first["bids"][0], "best ask", first["asks"][0])rows 1000 has_more True
2026-11-06T12:00:00.500Z 20 20
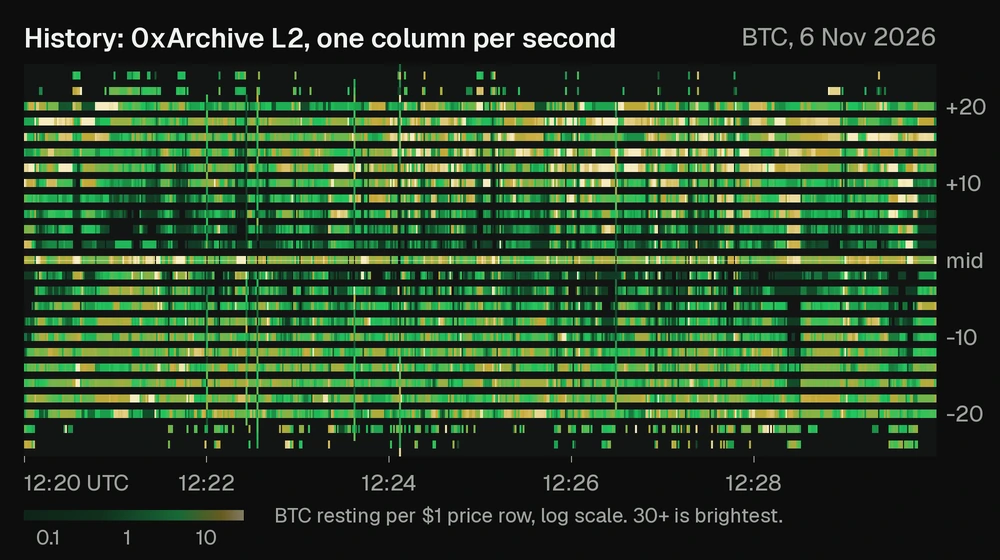
best bid {'px': '76137', 'sz': '14.38954', 'n': 45} best ask {'px': '76138', 'sz': '1.67594', 'n': 15}Ten minutes is 1,200 snapshots, so the page is full and has_more is true. Follow meta.next_cursor for the rest. This script does that, keeps the last snapshot in each second, and draws one column per second and one row per $1 with Pillow, plus the same grid in Plotly (pip install pillow plotly), bids in green and asks in gold:
import os, math, requests
from PIL import Image
import plotly.graph_objects as go

H = {"X-API-Key": os.environ["OXARCHIVE_API_KEY"]}
url = "https://api.0xarchive.io/v1/hyperliquid/orderbook/BTC/history"
params = {"start": 1793966400000, "end": 1793967000000, "limit": 1000}    # 6 Nov 2026, 12:00 to 12:10 UTC
books = []
while True:
    r = requests.get(url, headers=H, params=params, timeout=60).json()
    books += r["data"]
    if not r["meta"]["has_more"]:
        break
    params["cursor"] = r["meta"]["next_cursor"]

per_second = {b["timestamp"][:19]: b for b in books}           # keep the last book in each second
cols = [per_second[t] for t in sorted(per_second)]
mids = [(float(b["bids"][0]["px"]) + float(b["asks"][0]["px"])) / 2 for b in cols]
lo = round(min(mids)) - 30                                      # one row per $1, covering the whole move plus $30
rows = round(max(mids)) + 30 - lo + 1

bids = [[0.0] * len(cols) for _ in range(rows)]
asks = [[0.0] * len(cols) for _ in range(rows)]
for x, b in enumerate(cols):
    for side, grid in (("bids", bids), ("asks", asks)):
        for level in b[side]:
            y = round(float(level["px"])) - lo
            if 0 <= y < rows:
                grid[y][x] += float(level["sz"])

EMPTY, GREEN, GOLD = (19, 21, 20), (34, 197, 94), (198, 168, 55)
def colour(btc, hue):                                           # log scale from 0.05 BTC, 30+ BTC brightest
    if btc <= 0:
        return EMPTY
    t = min(1.0, max(0.15, math.log10(btc / 0.05) / math.log10(30 / 0.05)))
    return tuple(int(EMPTY[i] + (hue[i] - EMPTY[i]) * t) for i in range(3))

img = Image.new("RGB", (len(cols), rows))
for x in range(len(cols)):
    for y in range(rows):
        c = colour(bids[y][x], GREEN) if bids[y][x] else colour(asks[y][x], GOLD)
        img.putpixel((x, rows - 1 - y), c)                      # bids green, asks gold, higher prices at the top
grid = [[bids[y][x] + asks[y][x] for x in range(len(cols))] for y in range(rows)]
img.resize((len(cols) * 2, rows * 4), Image.NEAREST).save("heatmap.png")
# the same grid as an interactive chart you can zoom: log colour scale, empty cells stay blank
z = [[math.log10(v) if v > 0 else None for v in row] for row in grid]
fig = go.Figure(go.Heatmap(x=[b["timestamp"] for b in cols], y=[lo + y for y in range(rows)], z=z,
                           colorscale=[[0, "#131514"], [1, "#22c55e"]], colorbar={"title": "log10 BTC"}))
fig.update_layout(xaxis_title="UTC", yaxis_title="BTC price (USD)")
fig.write_html("heatmap.html")
print(len(books), "books,", len(cols), "seconds,", rows, "price rows from", lo, "to", lo + rows - 1)
print("busiest cell:", round(max(max(r) for r in grid), 2), "BTC")1312 books, 601 seconds, 197 price rows from 76032 to 76228
busiest cell: 54.28 BTCIt writes heatmap.png and heatmap.html, an interactive version you can zoom. The chart below is the same method on 12:20 to 12:30 UTC, with axes and a legend added:
For a longer view you rarely need every half second. /orderbook/{symbol}?timestamp=... returns the book at one moment. One snapshot an hour for 1 to 7 November took 168 requests and 16 seconds:
import os, requests

H = {"X-API-Key": os.environ["OXARCHIVE_API_KEY"]}
url = "https://api.0xarchive.io/v1/hyperliquid/orderbook/BTC"
day0 = 1793491200000                      # 1 Nov 2026, 00:00 UTC in Unix ms
for hour in range(3):                     # the week run loops this 168 times
    book = requests.get(url, headers=H, params={"timestamp": day0 + hour * 3_600_000, "depth": 20}).json()["data"]
    top_bid, top_ask = book["bids"][0], book["asks"][0]
print(book["timestamp"], len(book["bids"]), len(book["asks"]), "mid", book["mid_price"], "best bid size", top_bid["sz"], "best ask size", top_ask["sz"])2026-11-01T00:00:00Z 20 20 mid 77533.5 best bid size 0.00172 best ask size 29.83398
2026-11-01T01:00:00Z 20 20 mid 77638.5 best bid size 1.83701 best ask size 5.72808
2026-11-01T02:00:00Z 20 20 mid 77694.5 best bid size 7.97343 best ask size 3.95804Step 3: measure how long walls last
A bright cell invites a question: does that size hold? This script pulls every snapshot and every trade for BTC from 12:00 to 15:00 UTC on 6 November, then follows each wall. A wall here is one price level of at least 25 BTC, about $1.9 million, away from the top of the book. It lives while the level keeps half that size. When it ends, the script labels how:
- Traded through: a trade printed at or through its price in the last 2 seconds.
- Pulled: the size went while its price was still inside the 20 levels and no trade reached it. This is inferred from books and trades, not read from order records. Step 4 reads the order records behind three of them, cancels included.
- Left view: price moved and the level fell outside the 20 levels, so we cannot tell.
import os, sys, json, requests
from collections import Counter
from datetime import datetime, timezone

H = {"X-API-Key": os.environ["OXARCHIVE_API_KEY"]}
B = "https://api.0xarchive.io/v1/hyperliquid"
WALL = float(sys.argv[1]) if len(sys.argv) > 1 else 25.0   # BTC on one level
KEEP = 0.5                                                   # a wall lives while it holds half that
sec = lambda s: int(datetime.fromisoformat(s.replace("Z", "+00:00")).timestamp())

def pages(path, **params):
    while True:
        j = requests.get(f"{B}{path}", headers=H, params=params, timeout=120).json()
        yield from j["data"]
        if not j["meta"].get("has_more"):
            return
        params["cursor"] = j["meta"]["next_cursor"]

start = int(datetime(2026, 11, 6, 12, tzinfo=timezone.utc).timestamp() * 1000)
window = dict(start=start, end=start + 3 * 3_600_000)
book = {sec(r["timestamp"]): r for r in pages("/orderbook/BTC/history", limit=1000, **window)}   # last snapshot each second
prints = {}
for t in pages("/trades/BTC", limit=50000, **window):
    prints.setdefault(sec(t["timestamp"]), []).append(float(t["price"]))

live, walls = {}, []
for s in sorted(book):
    bids = {float(l["px"]): float(l["sz"]) for l in book[s]["bids"]}
    asks = {float(l["px"]): float(l["sz"]) for l in book[s]["asks"]}
    touch = {"bid": max(bids), "ask": min(asks)}
    now = {("bid", p): z for p, z in bids.items()} | {("ask", p): z for p, z in asks.items()}
    for (side, p), z in now.items():
        if (side, p) in live:
            live[side, p]["peak"] = max(live[side, p]["peak"], z)
        elif z >= WALL and abs(p - touch[side]) >= 2:          # big, and not at the touch
            live[side, p] = {"side": side, "px": p, "start": s, "peak": z}
    for (side, p), w in list(live.items()):
        if now.get((side, p), 0) >= KEEP * WALL:
            continue
        if (side, p) not in now and not min(bids) <= p <= max(asks):
            w["end_kind"] = "left view"
        elif any(x <= p if side == "bid" else x >= p for q in (s - 2, s - 1, s) for x in prints.get(q, [])):
            w["end_kind"] = "traded through"
        else:
            w["end_kind"] = "pulled"
        w["end"], w["life"], w["gap"] = s, s - w["start"], abs(p - touch[side])
        walls.append(live.pop((side, p)))

lives = sorted(w["life"] for w in walls)
print(len(book), "seconds of book,", sum(map(len, prints.values())), "fill rows")
print(f"walls of {WALL:g}+ BTC:", len(walls), dict(Counter(w["end_kind"] for w in walls)))
print("life in seconds: median", lives[len(lives) // 2], "90th pct", lives[int(len(lives) * 0.9)], "longest", lives[-1])
pulled = [w for w in walls if w["end_kind"] == "pulled"]
print("pulled $5+ from the touch:", sum(w["gap"] >= 5 for w in pulled))
w = max(walls, key=lambda w: w["life"])
print("longest:", w["side"], w["px"], datetime.fromtimestamp(w["start"], timezone.utc).strftime("%H:%M:%S"), f"{w['life']} s", w["end_kind"])
json.dump(walls, open(f"walls_{WALL:g}.json", "w"))10801 seconds of book, 129672 fill rows
walls of 25+ BTC: 1334 {'pulled': 351, 'left view': 416, 'traded through': 567}
life in seconds: median 1 90th pct 3 longest 29
pulled $5+ from the touch: 317
longest: ask 75706.0 14:24:11 29 s pulledThe script made 27 requests for 10,801 seconds of book and 129,672 fill rows. Each trade appears once per side, and Hyperliquid's own recentTrades returns the last 10. Run with 10 and 50 as the argument for the other thresholds:
| Wall size | Walls | How they ended | Life |
|---|---|---|---|
| 10+ BTC | 11,870 | 2,214 traded through, 5,269 pulled, 4,387 left view | median 1 s, longest 59 s |
| 25+ BTC | 1,334 | 567 traded through, 351 pulled, 416 left view | median 1 s, longest 29 s |
| 50+ BTC | 76 | 39 traded through, 8 pulled, 29 left view | median 1 s, longest 12 s |
No wall of 10 BTC or more stayed in view for a minute. At 25 BTC, 90% were gone within 3 seconds. These are times inside the 20 visible levels: 416 walls left that view, so their full life is unknown. 351 were pulled, 317 of them while price was still $5 or more away, and 567 ended because a trade reached them. At 25 BTC and above, trades ended more walls than cancels did.
Step 4: look up who placed a wall
L2 says a level holds 31 BTC. It does not say whether that is one order or thirty. /orderbook/{symbol}/l4?timestamp=... returns every resting order at a moment, with its address, in queue order within each price. This script takes the three longest-lived pulled walls from Step 3, reads the L4 book 3 seconds into each, groups the orders at the wall's price by address, then reads the largest address's order events from /orders/{symbol}/history:
import os, json, requests
from collections import Counter, defaultdict
from datetime import datetime, timezone

H = {"X-API-Key": os.environ["OXARCHIVE_API_KEY"]}
B = "https://api.0xarchive.io/v1/hyperliquid"
hms = lambda ms: datetime.fromtimestamp(ms / 1000, timezone.utc).strftime("%H:%M:%S")

walls = json.load(open("walls_25.json"))                         # written by the Step 3 script
for w in sorted((w for w in walls if w["end_kind"] == "pulled"), key=lambda w: -w["life"])[:3]:
    t0, t1 = w["start"] * 1000 + 3000, w["end"] * 1000           # read the book 3 s into the wall
    print(f"{w['side']} wall at {w['px']:,.0f}, {hms(w['start'] * 1000)} to {hms(t1)} UTC, peak {w['peak']:.1f} BTC, pulled")
    snap = requests.get(f"{B}/orderbook/BTC/l4", headers=H, params={"timestamp": t0}, timeout=120).json()["data"]
    at = [o for o in snap["bids" if w["side"] == "bid" else "asks"] if o["price"] == w["px"]]
    owners = defaultdict(float)
    for o in at:
        owners[o["user_address"]] += o["size"]
    total = sum(owners.values())
    print(f"  {len(at)} orders from {len(owners)} addresses, {total:.2f} BTC at {snap['timestamp'][11:19]}")
    for a, z in sorted(owners.items(), key=lambda kv: -kv[1])[:2]:
        print(f"  {a[:6]}..{a[-4:]}  {z:6.2f} BTC  {z / total:.0%}")
    top = max(owners, key=owners.get)
    ev = requests.get(f"{B}/orders/BTC/history", headers=H, timeout=60, params={
        "user": top, "start": t0 - 60_000, "end": t1 + 30_000, "limit": 1000}).json()["data"]
    for e in (e for e in ev if e.get("limit_price") == w["px"]):
print(" ", e["timestamp"][11:23], e["status"], "sell" if e["side"] == "A" else "buy", e["size"], "BTC", e.get("tif"))ask wall at 75,706, 14:24:11 to 14:24:40 UTC, peak 31.2 BTC, pulled
15 orders from 15 addresses, 31.39 BTC at 14:24:14
0x34fb..93de 13.20 BTC 42%
0x3947..f3b1 13.20 BTC 42%
14:24:10.676 open sell 13.20381 BTC Alo
14:24:40.186 canceled sell 13.20381 BTC Alo
ask wall at 76,183, 12:20:10 to 12:20:32 UTC, peak 32.3 BTC, pulled
11 orders from 11 addresses, 32.27 BTC at 12:20:13
0x34fb..93de 13.22 BTC 41%
0x3947..f3b1 13.22 BTC 41%
12:20:08.236 open sell 13.22395 BTC Alo
12:20:31.586 canceled sell 13.22395 BTC Alo
ask wall at 76,233, 12:33:03 to 12:33:22 UTC, peak 33.7 BTC, pulled
9 orders from 9 addresses, 33.34 BTC at 12:33:06
0xaf9f..a4fa 13.22 BTC 40%
0x3947..f3b1 13.22 BTC 40%
12:32:52.552 open sell 13.22395 BTC Alo
12:33:00.050 canceled sell 13.22395 BTC Alo
12:33:00.636 open sell 13.22395 BTC Alo
12:33:00.636 canceled sell 13.22395 BTC Alo
12:33:01.107 open sell 13.22395 BTC Alo
12:33:21.600 canceled sell 13.22395 BTC AloAll three walls share a shape. Two addresses each held a 13.2 BTC post-only sell (tif: Alo, an order that can only add liquidity), together 80 to 84% of the level. The rest was small orders from other addresses. Address 0x3947..f3b1 appears in all three. At 14:24 the largest address placed its order at 14:24:10.676, the level counted as a wall for 29 seconds, and the order was cancelled at 14:24:40.186 without a fill. At 12:33 the address re-posted the same 13.22395 BTC three times in nine seconds.
These are addresses, not identities. An address can be a market maker, a vault or a bot, and 0xArchive does not label it.
Step 5: see past 20 levels
The L4 book is not capped at 20 levels. At 12:20 UTC on 6 November:
import os, requests

H = {"X-API-Key": os.environ["OXARCHIVE_API_KEY"]}
B = "https://api.0xarchive.io/v1/hyperliquid"
T = 1793967600000                                   # 6 Nov 2026, 12:20 UTC

snap = requests.get(f"{B}/orderbook/BTC/l4", headers=H, params={"timestamp": T}, timeout=120).json()["data"]
orders = snap["bids"] + snap["asks"]
mid = (snap["bids"][0]["price"] + snap["asks"][0]["price"]) / 2
print(len(orders), "resting orders from", len({o["user_address"] for o in orders}), "addresses")
for usd in (23, 100, round(mid * 0.01)):
print(f"within ${usd} of the mid: {sum(o['size'] for o in orders if abs(o['price'] - mid) <= usd):,.0f} BTC")60530 resting orders from 6431 addresses
within $23 of the mid: 206 BTC
within $100 of the mid: 1,083 BTC
within $762 of the mid: 3,142 BTC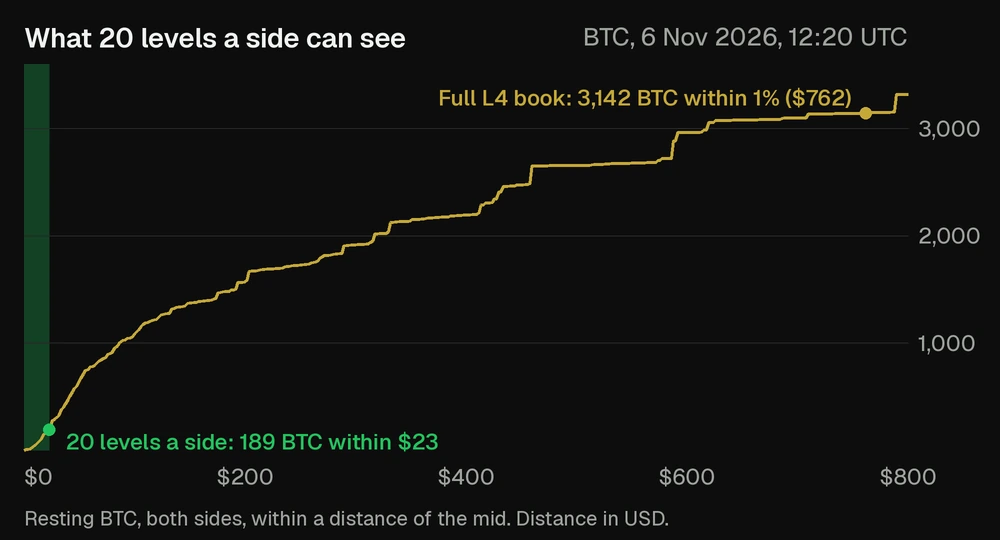
The 20-level book at that second showed 189 BTC within $23 of the mid. The full book held 3,142 BTC within 1%, so the 20-level view saw 6% of the size near the price. The response was 9.7 MB and took about a second. Pass depth to cap the orders per side when you only need the inside of the book.
Side by side: Hyperliquid's API and 0xArchive
The same jobs, run on 8 November 2026:
| Job | Hyperliquid's API (free) | 0xArchive |
|---|---|---|
| Live BTC book | l2Book WebSocket: 24 messages in 120 s, 20 levels a side | The same book over REST or WebSocket |
| A past heatmap | None from the API. The chart starts when you subscribe. Older books sit in monthly requester-pays S3 files. | L2 from 15 April 2023 |
| Three hours of half-second books | Three hours of recording | 23,598 snapshots, 24 requests, 7 s |
| Trades for the same window | recentTrades: the last 10 | 129,672 fill rows, 3 requests |
| Size beyond 20 levels | Not in the feed | L4: 60,530 resting orders, 9,580 BTC |
| Who placed a wall | Not in the feed | L4 from 11 March 2026: address on every order |
Hyperliquid's own feed is enough for a live heatmap of the inside of the book. 0xArchive adds the past, the depth past 20 levels and the address behind each order. For the full comparison, see Hyperliquid's native API vs 0xArchive.
Order book heatmap vs projected forced-liquidation levels
They answer different questions. An order book heatmap shows orders that are resting in the book. A map of projected forced-liquidation price levels is estimated from open positions, and no order rests there until a liquidation fires. For that view, see the guide to projected forced-liquidation price levels.
How to read a heatmap
Time runs left to right, price runs bottom to top, and colour is resting size: the brighter the cell, the more size sat at that price at that moment. Step 2 writes a zoomable Plotly version of the same grid.
- A bright row is rarely a floor. In three hours on 6 November, the median 25 BTC wall lasted 1 second and none lasted a minute.
- A vanishing wall is not proof of spoofing. Traders often call a wall that disappears as price nears it spoofing, but a cancel alone shows no intent: orders are pulled and repriced all the time. Step 4 shows how to look one up: who placed it, and whether it was cancelled or filled. A repeated pattern from one address says more than any single wall.
- Read the address before the size. A 31 BTC level that is two identical post-only orders, cancelled within seconds, is a quoting pattern. A level built from many unrelated addresses is a different signal.
- Width changes the picture. The 20-level view saw 6% of the size within 1% of the price.
- Your thresholds shape the numbers. Treat the counts above as one three-hour BTC window, not a constant.
What to know before you build
- L2 is 20 levels a side. Our samples from 15 April and 15 May 2023 held 10 a side, and 20 from 15 July 2023.
- L4 starts 11 March 2026 for Hyperliquid perpetuals. There are no addresses before that date.
- Snapshots are about 0.5 seconds apart. A wall that lived for less will not show.
- Types differ. L2 prices and sizes are strings. L4 prices and sizes are numbers.
- A wall can thin before you look. Read the L4 book a few seconds into the wall, as the script does.
FAQ
Can I get a Hyperliquid order book heatmap for a past date?
Not from Hyperliquid's own API, which keeps no book history. 0xArchive serves the 20-level book from 15 April 2023 and the full order-level book from 11 March 2026.
Does an order book heatmap show projected forced-liquidation price levels?
No. It plots orders resting in the book. Projected forced-liquidation price levels are estimated from open positions and need a separate view.
How many levels does Hyperliquid's order book feed show?
20 a side. For BTC on 8 November 2026 those covered a median $40 around the mid.
How long do order book walls last on Hyperliquid?
Briefly. In three hours of BTC on 6 November 2026, the median wall of 25 BTC or more lasted 1 second, and the longest 29 seconds.
Can I see who placed an order on Hyperliquid?
Yes, from 11 March 2026. The L4 book returns each resting order with its address. It is an address, not a name.
Next steps
- The L2 and L4 routes in full: Hyperliquid order book data API.
- What each depth contains: Level 1 vs Level 2 vs Level 3 vs L4.
- Pair the book with flow: How to Build a Hyperliquid Order Flow Dashboard.
- Projected forced-liquidation price levels, a different heatmap: heatmap of projected forced-liquidation price levels.
- Reference: L2 order books, L4 order books and Hyperliquid data.
Tested on 8 November 2026 on BTC. The prototype code was re-run on 9 November 2026 and reproduced every historical number.