
An order flow dashboard answers one question: are buyers or sellers hitting the book, and is that pressure building? This guide builds one for BTC on Hyperliquid, an onchain crypto exchange, from taker buy and sell volume, cumulative volume delta (CVD) and order activity. It starts live from Hyperliquid's own trade feed, then backfills a full week from 0xArchive and checks every number against raw trades. Everything ran on 8 November 2026, and every output is what came back.
Short answer
- Live CVD: Hyperliquid's free
tradesWebSocket carries the taker side:Bis a taker buy,Aa taker sell. Delta is taker buy USD minus taker sell USD, and CVD is the running sum. It starts at zero when your script starts. - History:
GET /v1/hyperliquid/cvd/{symbol}returned a week of hourly taker buy, sell and delta in one request and 0.12 seconds. Hyperliquid'srecentTradesreturned 10 trades covering 16 seconds. - Exact: for three hours on 6 November, the CVD route matched 129,672 raw fill rows and the candle's quote volume to the dollar.
- Order activity is a separate measure:
/orders/{symbol}/flowcounts order events per bucket: placements, cancels and fills. In the median hour of that week there were 79 cancel events for every fill event.
Why build this on Hyperliquid
Every Hyperliquid fill is public, with the side that took liquidity. That makes taker flow something you measure, not something you estimate from candle colour. 0xArchive serves Hyperliquid trades from 15 April 2023, complete from 22 March 2025, so a dashboard can open already filled in with months of flow.
What you need
- Python 3 with
requestsandwebsockets. The snippets are short prototypes with no retry logic. - A 0xArchive API key in
OXARCHIVE_API_KEY. Hyperliquid's own API needs no key. The free plan covers a rolling 30 days; the retained archive needs a paid plan, listed on pricing.
Step 1: see what the native API gives you
Hyperliquid's recentTrades request returns the latest trades for a coin:
import requests

r = requests.post("https://api.hyperliquid.xyz/info", json={"type": "recentTrades", "coin": "BTC"}).json()
times = [t["time"] for t in r]
print("rows", len(r), "seconds covered", (max(times) - min(times)) / 1000)
print(r[0])rows 10 seconds covered 15.939
{'coin': 'BTC', 'side': 'A', 'px': '76008.0', 'sz': '0.02967', 'time': 1794154934163, 'hash': '0x48b8...0084f6d8b8f7ec8156f21ad9740f', 'tid': 362349331820560, 'users': ['0xf5d8...f226', '0x6c5e...39c6']}Ten rows, covering 16 seconds. It is the only market-wide trade request in Hyperliquid's info API, and it has no volume split by buyer and seller. Its candles carry o h l c v n and no taker split either. To build flow from the native API you must listen live and keep your own tape.
The live feed is good for that. The trades WebSocket pushes each trade with side, the taker side: B means the taker bought. We checked this against 0xArchive for 48 trades and the taker side matched on all 48. Here is a live CVD, in dollars, from 30 seconds of the feed:
import asyncio, json, time, websockets

async def main(seconds=30):
    cvd = 0.0
    async with websockets.connect("wss://api.hyperliquid.xyz/ws") as ws:
        await ws.send(json.dumps({"method": "subscribe", "subscription": {"type": "trades", "coin": "BTC"}}))
        t0, n = time.time(), 0
        while time.time() - t0 < seconds:
            msg = json.loads(await ws.recv())
            if msg.get("channel") != "trades":
                continue
            for t in msg["data"]:            # side is the taker side: B = taker bought
                v = float(t["px"]) * float(t["sz"])
                cvd += v if t["side"] == "B" else -v
                n += 1
        print("trades", n, "running CVD in USD", round(cvd))

asyncio.run(main())trades 54 running CVD in USD 37221In a longer 120-second run the same loop counted 193 trades: $153,002 of taker buying, $57,081 of taker selling, a delta of $95,921. That is a true CVD for the window, and it is all Hyperliquid's own API can give you: it starts at zero when your script starts. If the connection drops, the running total breaks. Fill the gap from history before you carry on, or the CVD silently restarts.
Step 2: read CVD from 0xArchive
GET /v1/hyperliquid/cvd/{symbol} returns taker buy and sell notional per bucket, their difference and a running total. Intervals are 1m, 5m, 15m, 30m, 1h, 4h, 1d and 1w.
import os, time, requests

H = {"X-API-Key": os.environ["OXARCHIVE_API_KEY"]}
now = int(time.time() * 1000)
r = requests.get("https://api.0xarchive.io/v1/hyperliquid/cvd/BTC", headers=H,
                 params={"interval": "5m", "start": now - 20 * 60_000, "end": now}).json()
for b in r["data"]:
    print(b)
print(r["meta"]){'timestamp': 1794153900000, 'buy_volume': 768684.2062900002, 'sell_volume': 1176895.7196499994, 'delta': -408211.51335999917, 'cumulative_delta': -408211.51335999917}
{'timestamp': 1794154200000, 'buy_volume': 258183.6344900001, 'sell_volume': 79817.34994999999, 'delta': 178366.28454000014, 'cumulative_delta': -229845.22881999903}
{'timestamp': 1794154500000, 'buy_volume': 186225.57398999963, 'sell_volume': 220309.78493, 'delta': -34084.21094000037, 'cumulative_delta': -263929.4397599994}
{'timestamp': 1794154800000, 'buy_volume': 20686.47555, 'sell_volume': 465802.25275000004, 'delta': -445115.77720000007, 'cumulative_delta': -709045.2169599994}
{'count': 4, 'request_id': 'dc6491c6-77cb-4113-aa60-8784a38bd539', 'has_more': False, 'symbol': 'BTC', 'venue': 'hyperliquid'}The fields are exact: timestamp (bucket open, Unix milliseconds), buy_volume and sell_volume (taker notional in USD), delta (buy minus sell) and cumulative_delta. Two details bite. The last bucket may still be open, and a response is a page: cumulative_delta runs from the first bucket of that page, so across pages you rebuild it from delta. We tested that on one day of 1-minute buckets in three pages (03_backfill.py below): each page restarted its running total, and the sum of delta over the day was -$28,151,246 while the last page's own cumulative_delta read -$32,209,323.
Step 3: check it against raw trades
Do not trust a number you have not rebuilt once. In the fills, each trade appears as two rows. The row with crossed: true is the taker, and its side says whether the taker bought. This rebuilds three hours of BTC flow on 6 November from raw fills and compares it with the CVD route and the hourly candle's quote_volume:
import os, datetime as dt, requests

H = {"X-API-Key": os.environ["OXARCHIVE_API_KEY"]}
B = "https://api.0xarchive.io/v1/hyperliquid"
ms = lambda *a: int(dt.datetime(*a, tzinfo=dt.timezone.utc).timestamp() * 1000)
S, E = ms(2026, 11, 6, 12), ms(2026, 11, 6, 15)

def get(path, **params):
    return requests.get(f"{B}{path}", headers=H, params=params, timeout=60).json()

def pages(path, **params):
    while True:
        j = get(path, **params)
        yield from j["data"]
        if not j["meta"].get("has_more"):
            return
        params["cursor"] = j["meta"]["next_cursor"]

cvd = {b["timestamp"]: b for b in get("/cvd/BTC", start=S, end=E, interval="1h")["data"]}
candles = {ms(*map(int, c["timestamp"][:13].replace("T", "-").split("-"))): c
           for c in get("/candles/BTC", start=S, end=E, interval="1h")["data"]}

rebuilt, rows = {}, 0
for t in pages("/trades/BTC", start=S, end=E, limit=50000):
    rows += 1
    if not t["crossed"]:          # each trade has two rows; crossed marks the taker
        continue
    hour = ms(*map(int, t["timestamp"][:13].replace("T", "-").split("-")))
    side = "buy" if t["side"] == "B" else "sell"
    rebuilt.setdefault(hour, {"buy": 0.0, "sell": 0.0})[side] += float(t["price"]) * float(t["size"])

print("fill rows", rows)
print("hour   cvd buy     rebuilt buy | cvd sell    rebuilt sell | buy+sell    candle quote")
for h in sorted(rebuilt):
    c, r = cvd[h], rebuilt[h]
    print(dt.datetime.fromtimestamp(h / 1000, dt.timezone.utc).strftime("%H:%M"),
          f"{c['buy_volume']:12,.0f} {r['buy']:12,.0f} | {c['sell_volume']:12,.0f} {r['sell']:12,.0f} |",
f"{c['buy_volume'] + c['sell_volume']:12,.0f} {candles[h]['quote_volume']:12,.0f}")fill rows 129672
hour cvd buy rebuilt buy | cvd sell rebuilt sell | buy+sell candle quote
12:00 32,945,074 32,945,074 | 27,753,143 27,753,143 | 60,698,217 60,698,217
13:00 72,677,820 72,677,820 | 91,318,092 91,318,092 | 163,995,911 163,995,911
14:00 196,603,268 196,603,268 | 182,244,669 182,244,669 | 378,847,938 378,847,938All three agree to the dollar in every hour. One detail to know: with end at 15:00 the CVD route also returns the 15:00 bucket, because at 1h and longer a bucket counts when it opens inside [start, end]. The order flow route treats end as exclusive. Set your bounds to bucket opens so you never get a surprise partial bucket.
Step 4: add order flow
GET /v1/hyperliquid/orders/{symbol}/flow is a different measure from CVD, and the name invites a mix-up. It does not return buy and sell volume. It counts order-status events per bucket, not unique orders, and it starts on 10 March 2026.
import os, time, requests

H = {"X-API-Key": os.environ["OXARCHIVE_API_KEY"]}
now = int(time.time() * 1000)
r = requests.get("https://api.0xarchive.io/v1/hyperliquid/orders/BTC/flow", headers=H,
                 params={"interval": "5m", "start": now - 15 * 60_000, "end": now}).json()
for b in r["data"]:
print(b){'timestamp': '2026-11-08T16:05:00Z', 'limit_orders_placed': 20932, 'orders_canceled': 20734, 'orders_filled': 184, 'trigger_orders_placed': 30, 'tpsl_orders_placed': 8, 'orders_triggered': 10, 'orders_force_canceled': 12}
{'timestamp': '2026-11-08T16:10:00Z', 'limit_orders_placed': 27871, 'orders_canceled': 27745, 'orders_filled': 243, 'trigger_orders_placed': 68, 'tpsl_orders_placed': 23, 'orders_triggered': 0, 'orders_force_canceled': 13}
{'timestamp': '2026-11-08T16:15:00Z', 'limit_orders_placed': 23468, 'orders_canceled': 23455, 'orders_filled': 179, 'trigger_orders_placed': 83, 'tpsl_orders_placed': 25, 'orders_triggered': 0, 'orders_force_canceled': 9}
{'timestamp': '2026-11-08T16:20:00Z', 'limit_orders_placed': 12487, 'orders_canceled': 12374, 'orders_filled': 132, 'trigger_orders_placed': 39, 'tpsl_orders_placed': 11, 'orders_triggered': 4, 'orders_force_canceled': 17}The fields are timestamp (bucket open, an RFC 3339 string, where CVD uses milliseconds), limit_orders_placed, orders_canceled, orders_filled, trigger_orders_placed, tpsl_orders_placed, orders_triggered and orders_force_canceled. Intervals are 1m, 5m, 15m and 1h. In the 16:05 bucket above, 20,932 limit orders were placed and 20,734 cancelled, while 184 were filled. A filled status counts events, not trades, and carries no size, so do not read it as volume.
What it shows you is churn. Most orders on Hyperliquid are placed and cancelled without ever trading, and the ratio moves with market conditions. It starts on 10 March 2026 for BTC (the 22:00 UTC bucket that day is the first full one), so it is a shorter history than CVD.
Step 5: backfill a week
This is the job Hyperliquid's own API cannot do after the fact. One request each pulls seven days of hourly CVD, order flow and candles for BTC, then summarizes the week:
import os, statistics, datetime as dt, requests

H = {"X-API-Key": os.environ["OXARCHIVE_API_KEY"]}
B = "https://api.0xarchive.io/v1/hyperliquid"
ms = lambda *a: int(dt.datetime(*a, tzinfo=dt.timezone.utc).timestamp() * 1000)
S, E = ms(2026, 11, 1), ms(2026, 11, 7, 23)   # hourly buckets that open from 1 Nov 00:00 to 7 Nov 23:00

def get(path, **params):
    return requests.get(f"{B}{path}", headers=H, params=params, timeout=60).json()["data"]

cvd = get("/cvd/BTC", start=S, end=E, interval="1h", limit=10000)
flow = get("/orders/BTC/flow", start=S, end=E + 3_600_000, interval="1h", limit=10000)   # flow treats end as exclusive
candles = get("/candles/BTC", start=S, end=E, interval="1h", limit=10000)
print("buckets: cvd", len(cvd), "flow", len(flow), "candles", len(candles))

buy = sum(b["buy_volume"] for b in cvd)
sell = sum(b["sell_volume"] for b in cvd)
run, path = 0.0, []
for b in cvd:                       # rebuild the running total from delta: cumulative_delta restarts on every page
    run += b["delta"]
    path.append(run)
worst = min(cvd, key=lambda b: b["delta"])
agree = sum((b["delta"] > 0) == (c["close"] > c["open"]) for b, c in zip(cvd, candles))
usd = lambda v: ("-" if v < 0 else "") + f"${abs(v) / 1e6:,.0f}M"
churn = [f["orders_canceled"] / f["orders_filled"] for f in flow if f["orders_filled"]]

print(f"taker buy ${buy / 1e9:.2f}B  sell ${sell / 1e9:.2f}B  buy share {buy / (buy + sell):.1%}  net {usd(buy - sell)}")
print(f"CVD high {usd(max(path))}  low {usd(min(path))}  worst hour {usd(worst['delta'])} at",
      dt.datetime.fromtimestamp(worst["timestamp"] / 1000, dt.timezone.utc).strftime("%d %b %H:%M"))
print(f"delta sign matched candle direction in {agree} of {len(cvd)} hours")
print(f"limit orders placed {sum(f['limit_orders_placed'] for f in flow) / 1e6:.1f}M  cancelled {sum(f['orders_canceled'] for f in flow) / 1e6:.1f}M  filled {sum(f['orders_filled'] for f in flow) / 1e6:.2f}M")
print(f"cancels per fill: median {statistics.median(churn):.0f} range {min(churn):.0f} to {max(churn):.0f}")buckets: cvd 168 flow 168 candles 168
taker buy $9.27B sell $9.74B buy share 48.8% net -$468M
CVD high $92M low -$487M worst hour -$92M at 05 Nov 22:00
delta sign matched candle direction in 108 of 168 hours
limit orders placed 136.2M cancelled 134.7M filled 2.00M
cancels per fill: median 79 range 24 to 157Three requests returned 168 hourly buckets each. Takers bought $9.27 billion and sold $9.74 billion, so CVD ended the week $468 million negative. Its low was -$487 million, and the worst single hour was 5 November at 22:00 UTC. The sign of the hourly delta matched the candle's direction in 108 of 168 hours, 64%: flow moves with price more often than not, but it does not decide it.
Rebuild the running total from delta, as the script does. cumulative_delta restarts on every page: one day of 1-minute buckets came back in pages of 500, 500 and 441, and the sum of delta over the day was -$28,151,246 while the last page's own cumulative_delta read -$32,209,323. Below 1h a page can also be short and still carry a cursor, so stop on the cursor, not the page size.
To see how far back the data reaches, ask for daily buckets:
import os, datetime as dt, requests

H = {"X-API-Key": os.environ["OXARCHIVE_API_KEY"]}
B = "https://api.0xarchive.io/v1/hyperliquid"
ms = lambda *a: int(dt.datetime(*a, tzinfo=dt.timezone.utc).timestamp() * 1000)
day = lambda m: dt.datetime.fromtimestamp(m / 1000, dt.timezone.utc).strftime("%Y-%m-%d")

daily = requests.get(f"{B}/cvd/BTC", headers=H, timeout=60, params={
    "start": ms(2023, 4, 1), "end": ms(2025, 4, 5), "interval": "1d", "limit": 10000}).json()["data"]
print(len(daily), "daily buckets, first", day(daily[0]["timestamp"]))
for b in daily:
    if "2025-03-19" <= day(b["timestamp"]) <= "2025-03-24":
print(day(b["timestamp"]), f"{b['buy_volume'] + b['sell_volume']:>16,.0f} USD taker volume")703 daily buckets, first 2023-04-19
2025-03-19 863,263,560 USD taker volume
2025-03-20 873,995,387 USD taker volume
2025-03-21 400,167,114 USD taker volume
2025-03-22 394,026,086 USD taker volume
2025-03-23 1,061,106,657 USD taker volume
2025-03-24 2,587,750,831 USD taker volumeOne request reached back to 19 April 2023. 0xArchive's API reference marks Hyperliquid trade history before 22 March 2025 as incomplete, and candles start on that date, so compare flow within the same era and start any price-joined dashboard there.
Side by side: Hyperliquid's API and 0xArchive
| Row label | Hyperliquid native API | 0xArchive |
|---|---|---|
| Recent trades | 10 rows, 16 seconds of BTC | 129,672 fill rows for 3 hours in 3 requests |
| Buy and sell split | Trades feed carries the taker side; you total it yourself | /cvd returns buy_volume, sell_volume, delta per bucket |
| CVD history | Starts when your script starts | Daily buckets from 19 April 2023 |
| One week, hourly | Not possible after the fact | 168 buckets, 1 request, 0.12 s |
| Order activity counts | Not offered | /orders/BTC/flow, from 10 March 2026 |
| Cost | Free, no key | Free plan: last 30 days. Longer history on paid plans. |
If you only need a live CVD for the next hour, the native WebSocket is enough and free. You need 0xArchive when the chart should open already filled in, or when the question is about last week.
Step 6: draw the dashboard
Four panels on one time axis: price, taker buy and sell bars, CVD rebuilt from delta, and cancel events per fill event. This script makes the same three requests as Step 5 and writes an interactive dashboard.html (pip install requests plotly):
"""dashboard.py: a four-panel BTC order flow dashboard, 1 to 7 November 2026, hourly. Writes dashboard.html.
pip install requests plotly. Set OXARCHIVE_API_KEY."""
import os, datetime as dt, itertools, requests
import plotly.graph_objects as go
from plotly.subplots import make_subplots

H = {"X-API-Key": os.environ["OXARCHIVE_API_KEY"]}
B = "https://api.0xarchive.io/v1/hyperliquid"
ms = lambda *a: int(dt.datetime(*a, tzinfo=dt.timezone.utc).timestamp() * 1000)
S, E = ms(2026, 11, 1), ms(2026, 11, 7, 23)
get = lambda p, **q: requests.get(f"{B}{p}", headers=H, params=q, timeout=60).json()["data"]
cvd = get("/cvd/BTC", start=S, end=E, interval="1h", limit=10000)
flow = get("/orders/BTC/flow", start=S, end=E + 3_600_000, interval="1h", limit=10000)
candles = get("/candles/BTC", start=S, end=E, interval="1h", limit=10000)

t = [b["timestamp"] for b in cvd]
deltas = [b["delta"] for b in cvd]
running = list(itertools.accumulate(deltas))                   # CVD over the whole window, not per page
churn = [f["orders_canceled"] / f["orders_filled"] if f["orders_filled"] else None for f in flow]

fig = make_subplots(rows=4, cols=1, shared_xaxes=True, vertical_spacing=0.04,
                    subplot_titles=("BTC price (USD)", "Taker buy and sell (USD)", "CVD (USD)", "Cancel events per fill event"))
fig.add_trace(go.Scatter(x=[c["timestamp"] for c in candles], y=[c["close"] for c in candles], name="close"), 1, 1)
fig.add_trace(go.Bar(x=t, y=[b["buy_volume"] for b in cvd], name="taker buy", marker_color="#22c55e"), 2, 1)
fig.add_trace(go.Bar(x=t, y=[-b["sell_volume"] for b in cvd], name="taker sell", marker_color="#c6a837"), 2, 1)
fig.add_trace(go.Scatter(x=t, y=running, name="CVD"), 3, 1)
fig.add_trace(go.Scatter(x=[f["timestamp"] for f in flow], y=churn, name="cancels per fill"), 4, 1)
fig.update_layout(height=1000, barmode="relative", showlegend=False)
fig.write_html("dashboard.html")

print(len(cvd), "hours")
print(f"CVD at the end of the week: {running[-1] / 1e6:,.0f} million USD")
ok = [c for c in churn if c is not None]
print(f"cancels per fill: {min(ok):.0f} to {max(ok):.0f}")168 hours
CVD at the end of the week: -468 million USD
cancels per fill: 24 to 157To keep it live, load the week from history once, then append each closed hour. The chart below is the same week, drawn in our own style:
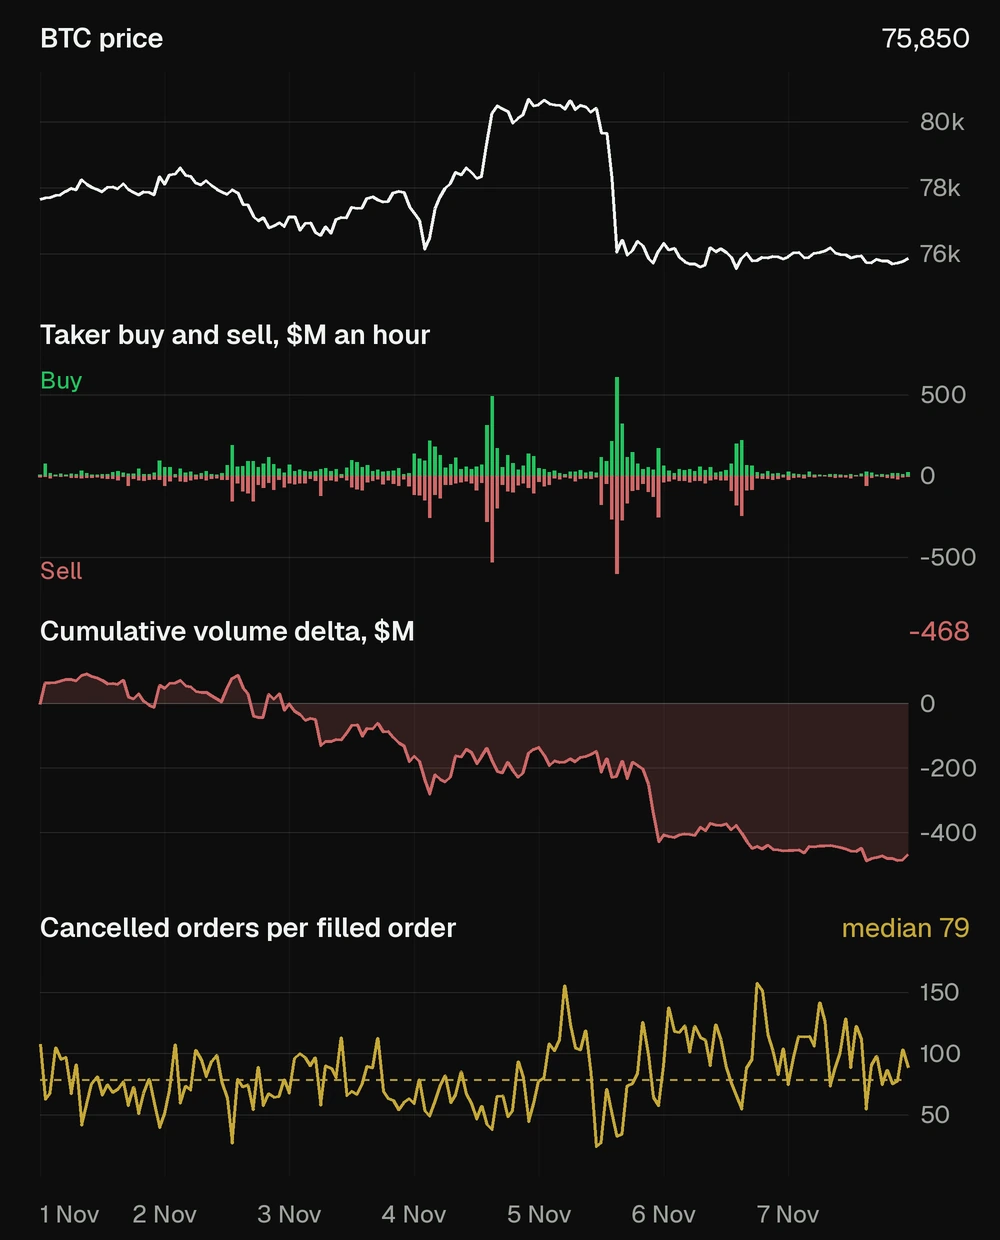
/cvd, /orders/{symbol}/flow and /candles.How to read it
- CVD with price: when price and CVD rise together, takers bought more than they sold through the move. When price rises while CVD falls, takers sold more than they bought and price rose anyway. CVD does not say why: check the book and the order flow panel before you call it absorption.
- Taker bars: one-sided spikes mark the hours someone paid to trade now. Compare their size with the hour's book depth.
- Cancel events per fill event: a jump means quotes are being pulled and replaced faster than they trade. It counts events, not cancelled size. In the week above it ranged from 24 to 157.
- What to put next to it: resting depth from an order book heatmap, large accounts from a whale tracker, and projected forced-liquidation price levels. Each is its own data source, not something to derive from CVD.
What to know before you build
- Taker side, not aggressor guesswork:
crossed: truemarks the taker row in fills, and the native tradesideis the taker side. /cvdand/orders/flowuse different timestamp formats and differentendrules. Normalise them before you join.- Rebuild
cumulative_deltafromdeltawhenever you page. - Order flow counts events, not size. Do not add
orders_filledto volume. - Treat CVD before 22 March 2025 as partial. Order flow starts 10 March 2026.
- CVD volumes are notional USD. Each trade counts once, on its taker's side, so buy plus sell equals the market's traded volume.
FAQ
Does Hyperliquid publish CVD?
No. Its API publishes trades with the taker side, through recentTrades (the latest 10) and the trades WebSocket, so a CVD built on it starts when you subscribe. 0xArchive serves it ready-made at /v1/hyperliquid/cvd/{symbol}.
How do I calculate CVD on Hyperliquid?
Add taker buy notional and subtract taker sell notional, bucket by bucket, then take a running total (itertools.accumulate in Python). From the native trades feed, side is the taker side. Or call /v1/hyperliquid/cvd/{symbol}, which returns the buckets and the delta.
How far back does Hyperliquid trade data go?
Hyperliquid's recentTrades returned ten rows. Hyperliquid also writes raw fills by block to a requester-pays S3 bucket, hl-mainnet-node-data, which you download and parse yourself. 0xArchive serves Hyperliquid trades by symbol and time window from 15 April 2023, and its API reference marks history before 22 March 2025 as incomplete.
What is the difference between delta and cumulative delta?
Delta is one bucket's taker buy notional minus its taker sell notional. Cumulative delta, or CVD, is the running total of those deltas from the start of your window, so its level depends on where you start and its slope is what you read.
Is order flow the same as buy and sell volume?
No. In 0xArchive, order flow counts order placements, cancellations, fills and triggers per bucket. Buy and sell volume comes from CVD.
Can I get CVD for any interval?
Yes: 1m, 5m, 15m, 30m, 1h, 4h, 1d and 1w. Buckets of 1h and longer roll up hourly totals.
Next steps
- Pair flow with the book: build an order book heatmap.
- Use the same data to test a signal: build a Hyperliquid trading bot.
- Read what tick data is and the historical data guide for backtesting.
- Browse trades, order flow and candles.
- Check the CVD and order flow references.
- See Hyperliquid data and pricing.
Tested 8 November 2026 on BTC.