
- 17.9%Cut in the expected shortfall of a long-BTC book from a minimum-variance BVIV hedge, mostly on crash days.
- 41%Of 8-hour periods where funding settled at its ±0.25% cap, costing a permanently long contract 24 vol points a year.
- $71Median daily volume in the BVIV perpetual, which traded on 576 of 914 days.
- 24.4%Cut in daily expected shortfall from shorting STRC, at a cost of 14.1% of BTC notional a year.
Gregor Albiez
October 2026
Abstract
A perpetual future on the Volmex BVIV index of Bitcoin implied volatility has traded on Bitfinex since April 2024. With 15-minute data from 1 January 2023 to 3 October 2026, including its complete Bitfinex record, we ask how BTC volatility should be forecast when a 30-day implied index is observable and whether a long-BVIV position, possibly timed by a volume-weighted average price (VWAP) signal, hedges BTC. HAR augmented with implied variance is the best one-day forecast, ahead of HAR in every year, significantly over the full window and in 2025 but not since the perpetual’s listing; HAR-IV leads at a week and the bias-corrected index at a month, neither significantly. With rules frozen on simulated training data and executed one bar after the signal at the mark, a minimum-variance BVIV hedge reduced the expected shortfall (ES) of a long-BTC book by 17.9% (95% block-bootstrap CI 6.2–32.4%), mostly on a handful of crash days in 2026. Funding settled at its ±0.25% cap in 41% of 8-hour periods and cost a permanently long contract 24 vol points a year; the perpetual traded a median $71 a day, and on its best days the hedge of a single bitcoin exceeded the market’s open interest. A VWAP ratchet added 2.37 points of ES reduction (CI [−0.22, +4.89]), but placebos with the same triggers at shifted dates captured most of it: the gain is mainly extra downside exposure, which holding the ratchet’s overlay permanently delivers too, with timing worth +0.34 points. Shorting Strategy’s STRC preferred cut daily ES by 24.4%, mostly on one crash day whose gain STRC’s return to par erased the next day (3.2% over ten days); it cost 14.1% of BTC notional a year and paid most in the issuer’s June 2026 funding squeeze. A calibrated simulation with an arbitrage-free perpetual reproduces the best forecast at each horizon and the split between exposure and timing. BVIV perpetuals worked as a crash hedge, but funding, execution speed and capacity, not signal design, decide what that hedge is worth.
Keywords: Bitcoin, implied volatility, BVIV, STRC, perpetual futures, hedging, VWAP. JEL: C22, C58, G11, G13, G17.
1 Introduction
A holder of bitcoin, in spot or through a perpetual swap, faces two kinds of risk: an ordinary random walk, and sudden crashes in which liquidity disappears and implied volatility spikes. Futures hedges remove the first and, with it, the position itself; crash protection has required options. The Volmex BVIV index measures 30-day BTC implied volatility in a model-free way (Babaoğlu, 2026), and it has traded as a USDT-margined perpetual on Bitfinex since April 2024 (Godbole, 2024), on gTrade since June 2025 (Godbole, 2025a) and on Hyperliquid since September 2026 (Godbole, 2026). Since June 2026 CME has also listed Bitcoin Volatility futures, settled on its own CME CF Bitcoin Volatility Index rather than on BVIV (CME Group, 2026).
Whether long volatility hedges long BTC depends on the spot-vol correlation, which in BTC is weak and unstable. In BTC, positive return shocks raised volatility more than negative ones before the 2013 crash (Bouri et al., 2017) and, with time-varying strength, for some years after (Takaishi, 2021), as they do for most large cryptocurrencies (Baur and Dimpfl, 2018); the asymmetry has since become small (Takaishi, 2021); the BTC–DVOL correlation flipped positive in early 2023 (Godbole, 2023), while BVIV held near 60 in late 2024 and fell to about 40 during the 2025 leg of the rally (Godbole, 2025b). Equity investors learned that long-volatility hedges look good ex ante but are eroded by carry and costs (Whaley, 2013; Alexander et al., 2016; Israelov, 2019), except in genuine crises (Szado, 2009). This raises two questions: what does such a hedge cost on a real crypto venue, and can it be timed by a signal every intraday trader watches, price relative to its VWAP?
Contributions
(i) We provide, to our knowledge, the first evidence on hedging BTC with a tradable implied-volatility perpetual, including an exact reconstruction of its funding rule, its realised costs and its capacity. (ii) We compare seven forecasts of BTC realised volatility, three of which use the official BVIV index. (iii) We test VWAP timing with rules frozen on simulated data, single-path block-bootstrap inference and a timing placebo that splits a rule’s edge into exposure and timing. (iv) A calibrated simulation with an arbitrage-free perpetual serves as a controlled experiment. (v) We test a credit hedge: shorting Strategy Inc.’s STRC preferred stock on Nasdaq and on Hyperliquid. A pipeline regenerates every number from public data, except one dated order-book snapshot and the STRC perpetual’s history (0xArchive).
2 The BVIV index and its perpetual
Index
BVIV is a 30-day constant-maturity implied-volatility index that applies the variance-swap replication of Demeterfi et al. (1999) to Deribit and OKX options, smoothed by an EWMA with a half-life of one to two minutes, and is disseminated every second (Babaoğlu, 2026); we use its 15-minute closes. Deribit’s DVOL applies a similar calculation to Deribit options alone (Deribit, 2021). Implied variance exceeds subsequent realised variance on average: Almeida et al. (2024) estimate about 0.14 a year in variance units for 2017–22, consistent with Alexander and Imeraj (2021) and the equity evidence of Carr and Wu (2009).
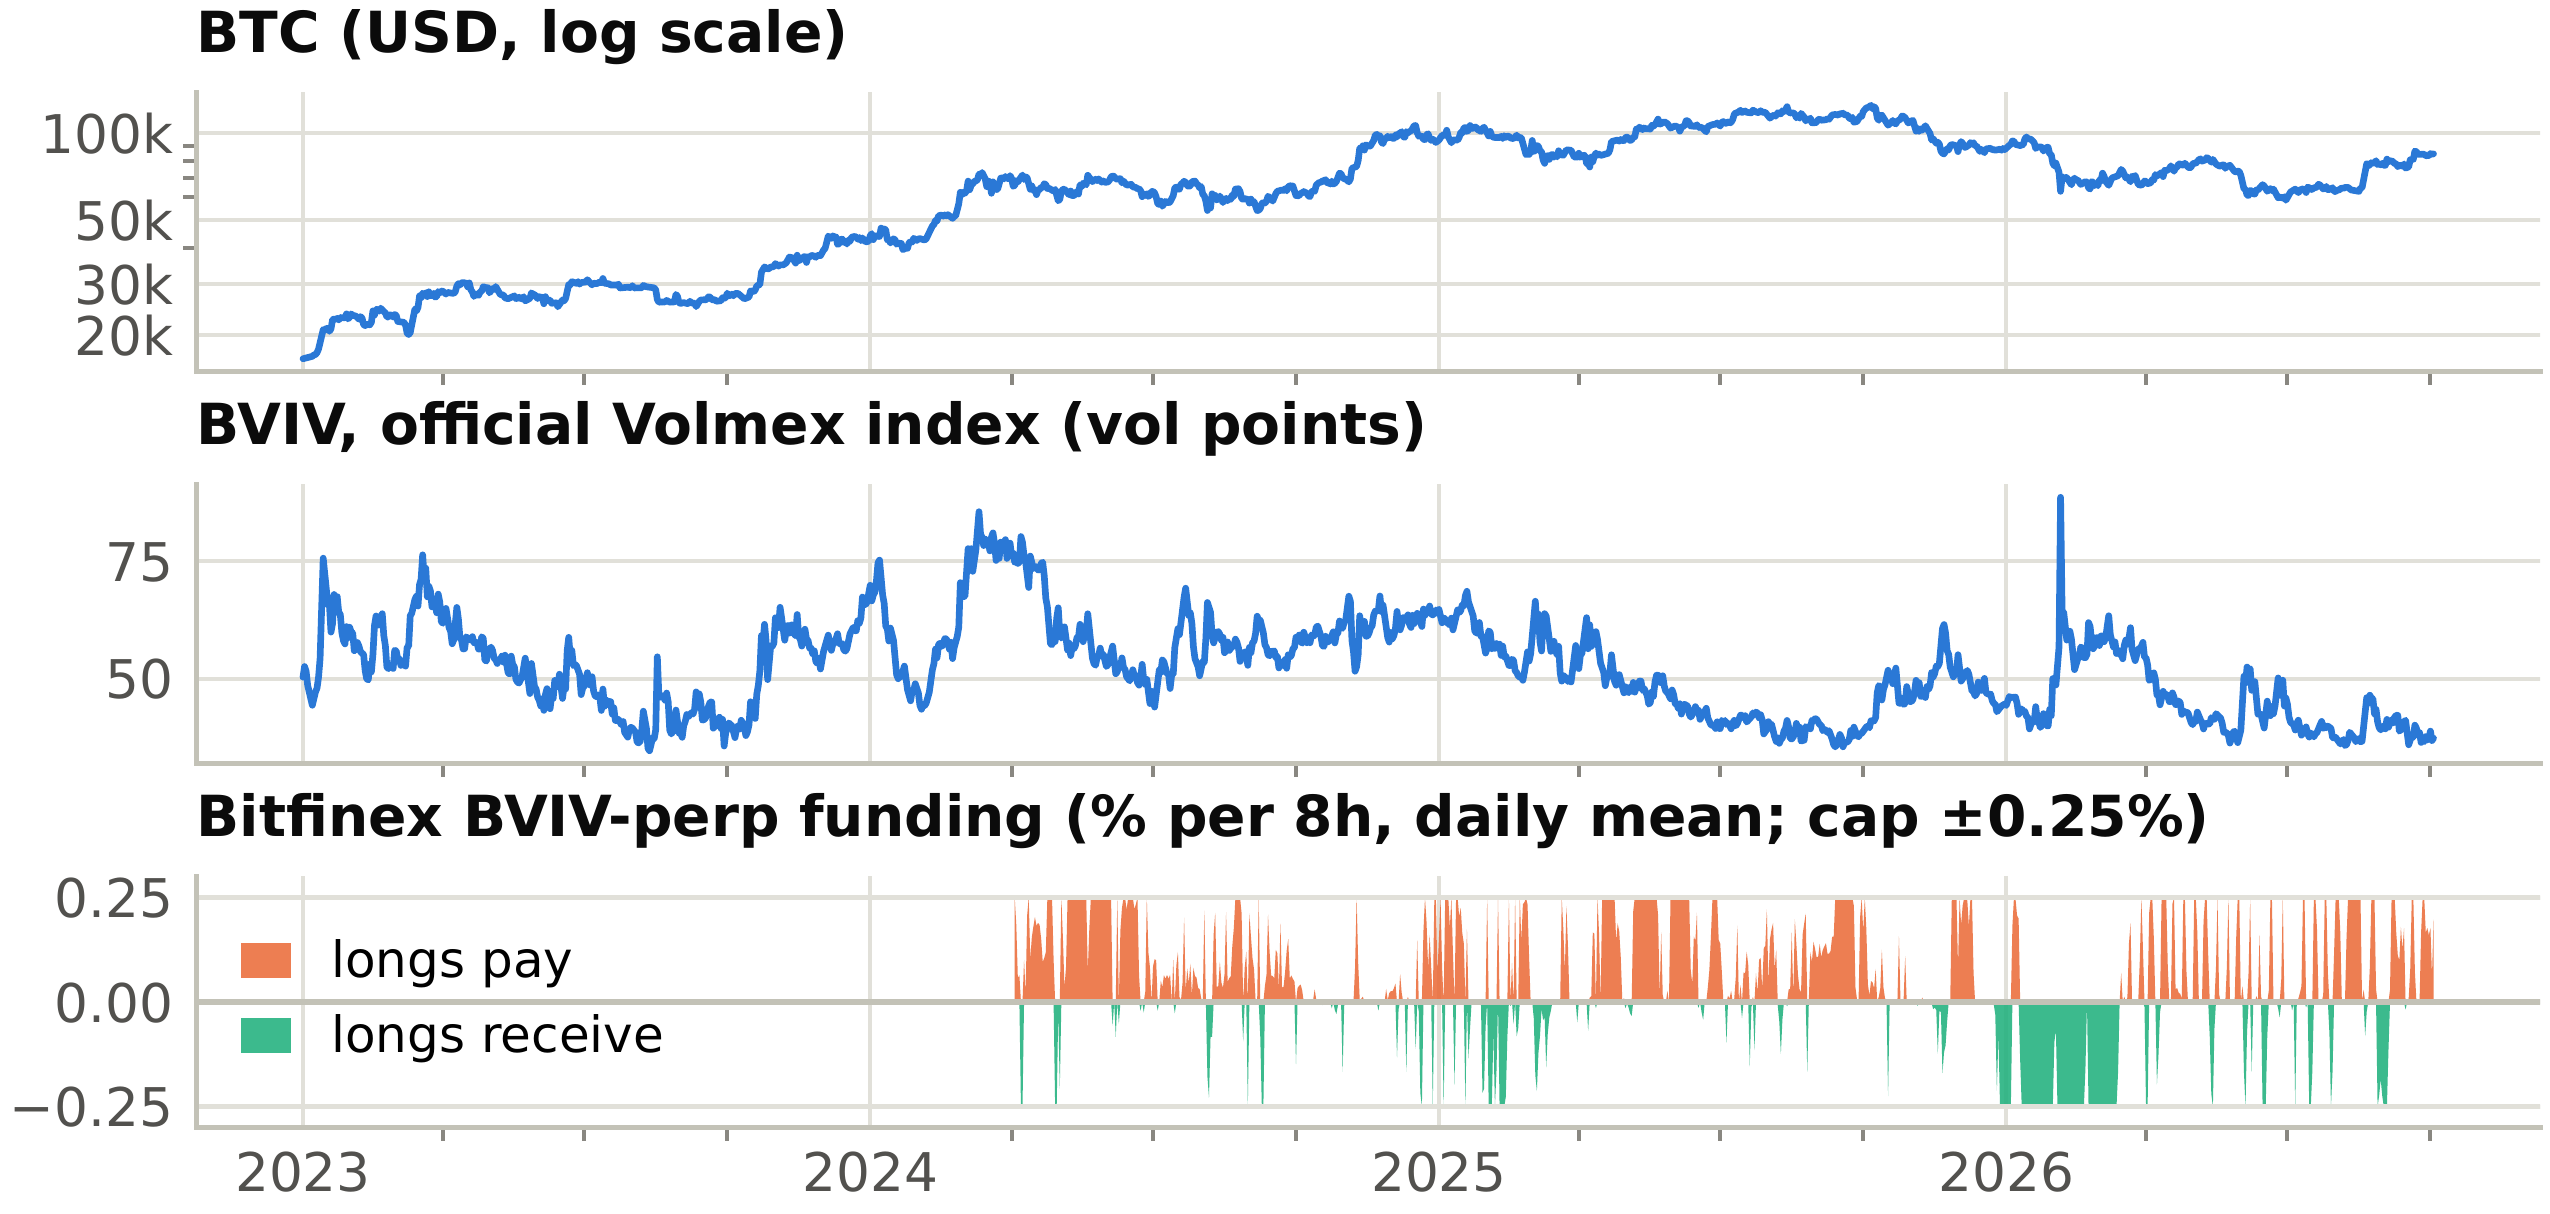
Figure 1: Live data, 1 January 2023 to 3 October 2026. Top: BTC (Binance). Middle: the official Volmex BVIV index. Bottom: Bitfinex BVIV-perpetual funding per 8-hour period (daily mean), paid by longs when positive.
The Bitfinex perpetual
One contract pays one dollar (USDt) per index point; the mark price is the index converted at USD/USDt and deviates from the official Volmex index by at most 0.15% on 95% of 15-minute bars. Funding settles every eight hours. The status feed exposes the accrued premium a of the perpetual over its mark, and the settled rates follow sign(a) min{max(|a| − 0.05%, 0), 0.25%} exactly (largest deviation 0.05 bp over all 2,740 settlements). The cap, 0.75% of notional a day, binds often: in 41% of settlements from April 2024 to October 2026, and longs paid on 52%. A permanently long contract paid 24 vol points a year on average (51% of notional), but the burden swung from 46 points a year in 2024 (from April) and 34 in 2025 to −12 a year in 2026 (to October): longs received 22 points in its first quarter and paid again from April, at 26 points a year (Figure 1). The market is tiny. The perpetual traded on 576 of 914 days, with a median daily volume of $71 (mean $7,300), and only 4.4% of 15-minute bars saw a trade. Its quoted mid sat a median 0.05% above the mark, but dust orders at the top of the book put it more than 5% away on 1.4% of bars (up to +276%), so it is not an executable price.
3 Data and volatility forecasts
Data
BTC is the Binance BTCUSDT spot market on 15-minute bars (1,372 days); quote volume over base volume gives each bar’s exact VWAP. BVIV is the official Volmex series from its public 15-minute history. The perpetual’s marks, quotes, open interest and accrued funding come from about 1.3 million Bitfinex status snapshots (one a minute), which also yield every funding settlement; trades come from Bitfinex’s trade candles. Volatility averaged 46.6% (Table 1) against a mean index of 51.9 (daily closes 34.7–88.5); implied exceeded subsequent realised volatility on 75% of days. The daily spot-vol correlation was −0.10 overall but moved from +0.32 in 2023 through +0.03 and −0.30 to −0.59 in 2026: the market became VIX-like. The index lags BTC: its 15-minute changes are autocorrelated (0.20), and 39% of its response to a 15-minute BTC return arrives in the three following bars, which matters for execution (Section 4).
Swipe for 5 more columns
| Moment | Live | 2023 | 2024 | 2025 | 2026 | Sim. |
|---|---|---|---|---|---|---|
| Realised vol, annualised (%) | 46.6 | 43.2 | 53.0 | 44.6 | 44.3 | 51.5 |
| Mean BVIV (vol pts) | 51.9 | 52.4 | 60.2 | 48.3 | 45.2 | 57.1 |
| IV − subsequent 30d RV (vol pts) | 6.8 | 7.6 | ||||
| Share of days IV > RV (%) | 75 | 78 | ||||
| corr(daily return, ΔIV) | −0.10 | 0.32 | 0.03 | −0.30 | −0.59 | −0.21 |
| corr on falling 15m bars | −0.24 | −0.26 | ||||
| AC(1) of 15m index changes | 0.20 | – | ||||
| Worst daily log return (−%) | 15.1 | 15.0 |
Table 1: Stylised facts: live sample (1 January 2023 to 3 October 2026) and by calendar year, against the median of the simulation’s 200 test paths (Section 6).
Forecasts
From 15-minute log returns we compute daily realised variance (Andersen et al., 2003); fifteen minutes is coarser than the 5-minute rule of thumb (Liu et al., 2015) but matches the hedge’s frequency. Each model forecasts the average daily variance over the next h ∈ {1, 7, 30} days from information at day t’s close: a random walk, RiskMetrics EWMA (J.P. Morgan/Reuters, 1996), GARCH(1,1) with Student-t errors (Bollerslev, 1986, 1987) re-estimated monthly, the heterogeneous autoregressive (HAR) model of Corsi (2009) with a 7-day week, the index itself, raw ((IVt/100)2/365, “IV-raw”) and bias-corrected (“IV”), and HAR augmented with implied variance:

HAR and IV are the special cases without the implied or the realised terms. Regressions run in logs, so forecasts exp(ŷ + s2/2), with s2 the residual variance, are positive, and are re-estimated daily on an expanding window of targets already observed. We evaluate the 1,006 one-day forecasts from 2024 on with QLIKE, which is robust to proxy noise (Patton, 2011), the Mincer–Zarnowitz R2 and Diebold–Mariano (DM) tests against HAR with Newey–West variance (Mincer and Zarnowitz, 1969; Diebold and Mariano, 1995; Newey and West, 1987).
| Row label | h = 1 day | h = 7 days | h = 30 days | ||||||
|---|---|---|---|---|---|---|---|---|---|
| Model | QL ratio | MZ R2 | DM t | QL ratio | MZ R2 | DM t | QL ratio | MZ R2 | DM t |
| RW | 1.71 | 0.16 | 10.47 | 1.33 | 0.15 | 2.56 | 1.42 | 0.09 | 1.70 |
| EWMA | 1.27 | 0.09 | 5.18 | 1.40 | 0.10 | 2.91 | 1.87 | 0.09 | 2.53 |
| GARCH | 1.41 | 0.10 | 8.96 | 1.95 | 0.09 | 5.29 | 3.52 | 0.14 | 3.21 |
| HAR | 1.00 | 0.21 | – | 1.00 | 0.19 | – | 1.00 | 0.02 | – |
| IV-raw | 1.24 | 0.15 | 6.07 | 1.06 | 0.22 | 0.79 | 0.91 | 0.26 | −0.65 |
| IV | 1.17 | 0.15 | 2.72 | 1.02 | 0.20 | 0.15 | 0.84 | 0.18 | −1.54 |
| HAR-IV | 0.96 | 0.26 | −2.25 | 0.95 | 0.25 | −0.74 | 0.92 | 0.16 | −0.60 |
Table 2: Live out-of-sample forecast accuracy, 2024 to October 2026. QL ratio: a model’s QLIKE over HAR’s (best in bold). DM t: Diebold–Mariano statistic against HAR (negative favours the model).
Results
At one day Table 2 agrees with Hoang and Baur (2020) on Deribit data: the index alone loses to HAR and the combination wins. At one day HAR-IV is best (QLIKE ratio 0.96) and ahead of HAR in each year (0.99, 0.93, 0.95), significantly in 2025 (DM −2.66) and over the whole window (DM −2.25) but not from the perpetual’s listing on (−1.83), while the index alone is worse (1.17) and GARCH on daily returns lags (1.41), as Bergsli et al. (2022) found for BTC. At longer horizons the leading models (HAR, HAR-IV and the index) are not significantly different. HAR-IV stays ahead at seven days (0.95; DM −0.74), where, unlike in their data, the bias-corrected index is no better than HAR (1.02); at 30 days the bias-corrected index is best (0.84; DM −1.54), followed by raw IV (0.91) and HAR-IV (0.92). The calibrated simulation has the same winner at every horizon (Section 6).
4 Hedging framework
P&L
The book is long q BTC at price St and long Ht ≥ 0 BVIV-perpetual contracts with mark Ft. A position Ht held from the close of 15-minute bar t earns over bar t+1

where 𝟙perp = 1 for a perpetual BTC book, Δt is the bar length in years, ft the BTC perpetual’s annualised funding rate, ψt the BVIV funding per contract, booked on the position held at each settlement, Pt the fill price, and c a proportional cost of 6 bp fee plus 10 bp slippage per side. On live data ψt is the settled funding. A perpetual on an index It is priced at the expected index sampled at a random time (He et al., 2022; Ackerer et al., 2026); in the simulation we split its funding into an arbitrage-free drift transfer 𝔼t[It+1] − It and a carry premium.
Execution
On live data a decision at the close of bar t is executed at the close of bar t+1 at the mark (P = F), plus costs. Same-bar execution would collect the index’s predictable catch-up after a BTC move (Section 3), and the quoted mid is not executable (Section 2); both are sensitivities (quotes capped at ±5% of the mark), as are costs of 50 bp per side on top of the fee, the price impact of one bitcoin’s hedge in the order book a day after the sample. No position is held before the listing at 09:00 UTC on 3 April 2024.
Hedge ratios and signal
The minimum-variance hedge is Ht∗ = −qStβt, with βt = Covt(r, ΔF)/Vart(ΔF) estimated on 15-minute BTC log returns r and mark changes ΔF by an EWMA (half-life 14 days) (Johnson, 1960; Ederington, 1979); we impose H ≥ 0. A downside ratio β−t = 𝔼t[r ΔF ∣ r < 0]/𝔼t[ΔF2 ∣ r < 0] on falling bars, shrunk towards βt with a two-day prior, gives the crash hedge H−t. The breakdown statistic compares the price with its rolling 24-hour VWAP,

because for Brownian prices the gap between the last price and its average over a window w has standard deviation σ√(w/3). Here σ̂t is the daily volatility implied by a causal EWMA (half-life one day) of 15-minute squared returns, de-seasonalised by a trailing hour-of-week profile (Andersen and Bollerslev, 1997; Hansen et al., 2024).
Rules
All rules are long-only, their targets are capped at 50% of BTC notional, and they trade only when the gap between target and position exceeds 25% of the larger of the two, or when a switch flips or the target drops to zero (Whalley and Wilmott, 1997), so held positions can drift above the cap (on live data at most 64% for the minimum-variance hedge and 72% for 1.5×). Always-on holds λH∗t with λ ∈ {1, 1.5}. The VWAP-switch holds H−t while a gate is on, switching on at zt < zin and off at zt > zout, for at least four hours. The VWAP-ratchet holds a core φH∗t plus an overlay ot that jumps to 1 on a breakdown and decays with half-life τ:

where mt = min{max(eκt, 0.5), 1.5} optionally scales the overlay by forecast “cheapness” κt: the log ratio of the 30-day HAR-IV forecast to implied variance, less its trailing 180-day median, lagged one day.
Protocol
Rule parameters were selected on 48 simulated training paths (Section 6), out of 72 ratchets and six switches, by median ES reduction net of costs, before the live study was run. The selected ratchet keeps the full core (φ = 1), triggers at z < −1.5, decays with a half-life of 4 days and uses forecast sizing; the selected switch enters at z < −1 and exits at z > 0.5. The live sample is therefore out of sample for the rules, which avoids data snooping (White, 2000; Hansen, 2005; Bailey et al., 2014), although the simulator’s calibration targets include coarse features of the 2023–26 market. The simulation, including the selection, fills on the signal bar, as its index has no lag; there the selected ratchet led the next by only 0.02 points, and one-bar fills would have picked zin = −1 (live timing value +0.11). Signals warm up on 2023 data, and hedging is evaluated over the 914 days since the listing, 3 April 2024 to 3 October 2026. On a single path we report 95% intervals from a paired stationary block bootstrap (Politis and Romano, 1994) over days (mean block ten days, 2,000 draws); for seven mean block lengths from 1 to 40 days the lower bound of the always-on ES reduction lies between 4.4% and 7.3%. The timing placebo shifts a ratchet’s trigger series circularly within the whole weeks of the evaluation window, by every multiple of a week for the selected rule (129 shifts) and of two weeks for each rule of the grid (64 shifts). It keeps the triggers’ number, clustering and hour-of-week profile but breaks their link to the market. A ratchet’s edge over the always-on hedge then splits into exposure, the placebo mean minus the always-on result, and timing, the ratchet minus its placebo mean.
5 Results on live data
Swipe for 8 more columns
| Rule | ES red. | Var red. | Max DD | Tail offset | Hedge P&L | Funding | Trading | Turnover | Notional |
|---|---|---|---|---|---|---|---|---|---|
| Unhedged | 0.0 | 0.0 | 53.0 | 0.0 | 0.00 | 0.00 | 0.00 | 0.0 | 0.0 |
| Always-on (MV) | 17.9 | 14.9 | 41.7 | 26.9 | 2.13 | 1.41 | 0.20 | 1.3 | 11.1 |
| Always-on, 1.5× | 20.1 | 13.2 | 41.9 | 38.7 | 1.07 | 2.21 | 0.29 | 1.8 | 16.7 |
| VWAP-switch | 18.8 | 12.6 | 42.5 | 25.6 | 6.71 | −0.26 | 5.17 | 32.3 | 4.6 |
| VWAP-ratchet | 20.3 | 15.0 | 42.6 | 30.6 | 1.35 | 2.67 | 0.37 | 2.3 | 12.5 |
Table 3: Hedging a 1-BTC spot book with the Bitfinex BVIV perpetual, 3 April 2024 to 3 October 2026, executed one bar after the signal at the mark (%, except turnover). ES/Var red.: reduction in daily ES97.5 and variance against unhedged. Max DD: maximum drawdown of compounded daily returns. Tail offset: hedge P&L net of costs as a share of BTC losses on the worst 5% of days. Hedge P&L (index P&L minus funding), Funding and Trading (fees and slippage): % of BTC notional a year. Turnover: perpetual notional traded per year over BTC notional. Notional: average hedge notional in % of BTC.
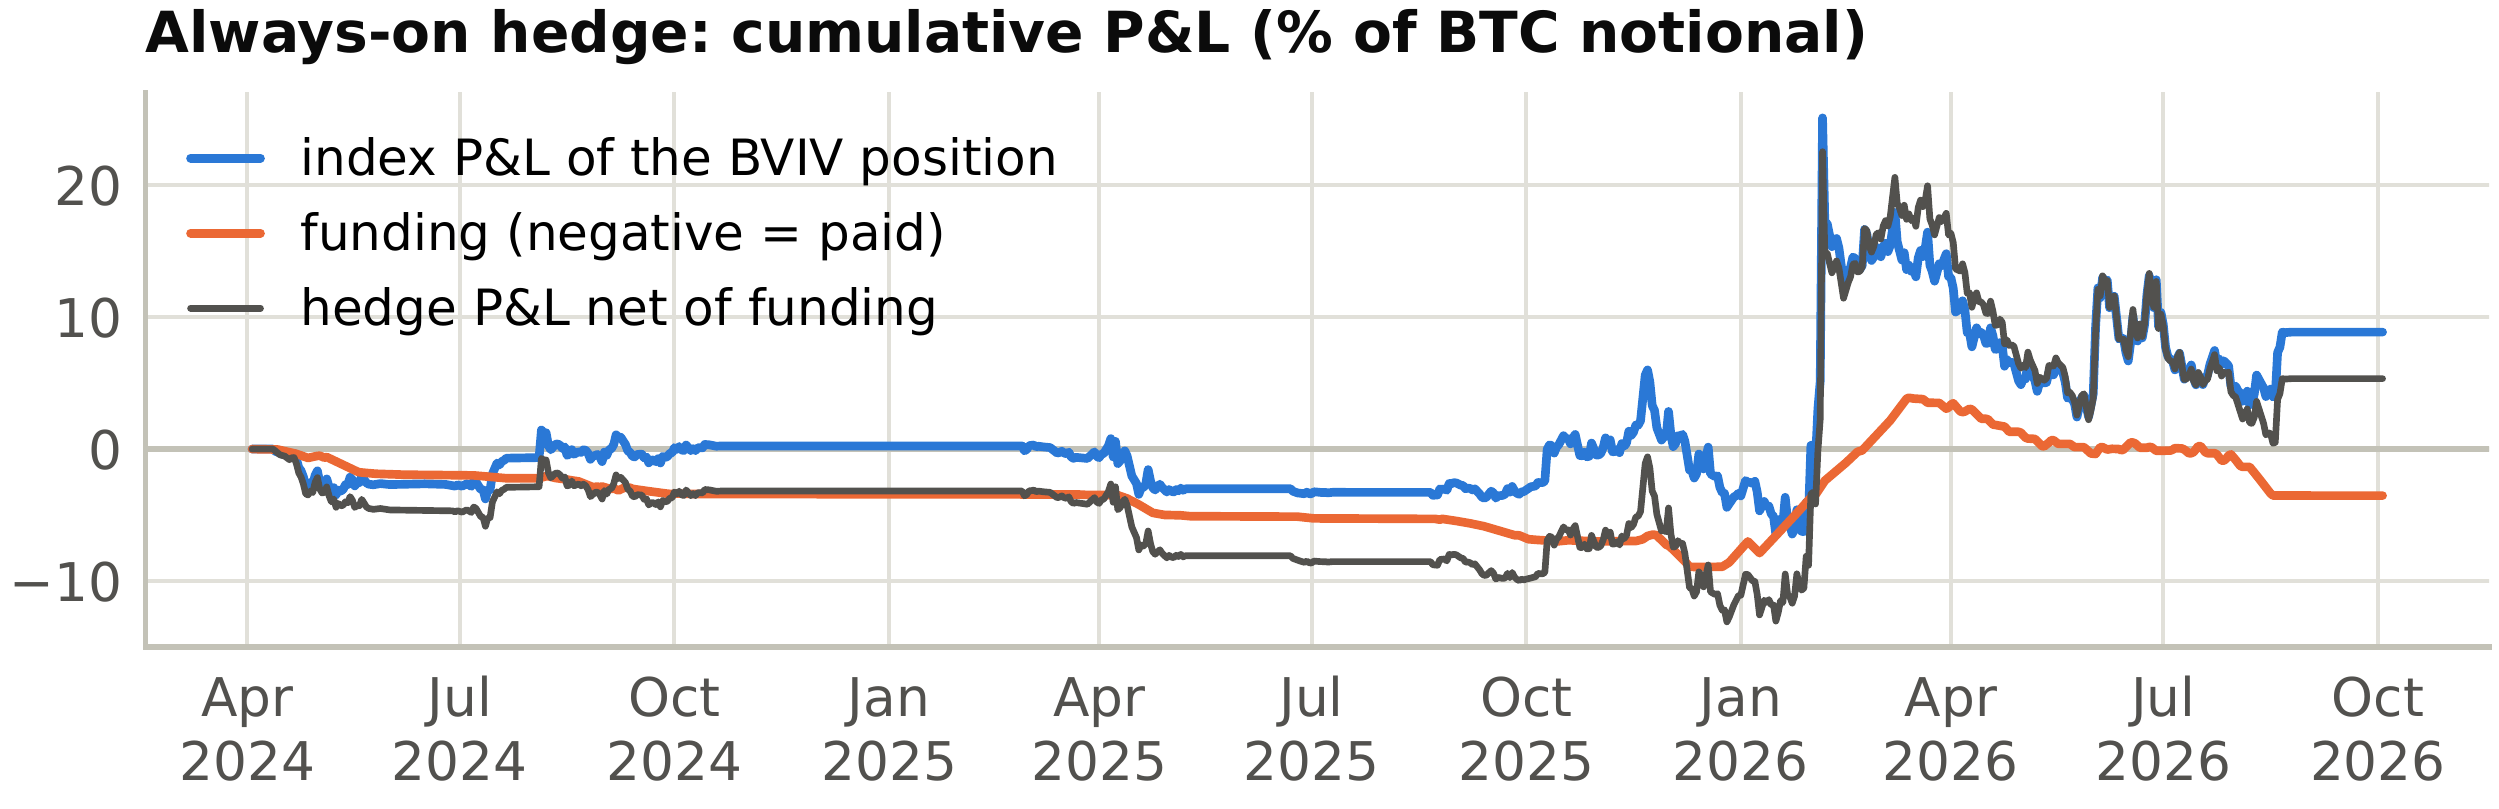
Figure 2: Always-on minimum-variance hedge on live data: cumulative index P&L of the BVIV position, cumulative funding (negative = paid), and hedge P&L net of funding, in % of BTC notional.
The hedge works, in crashes
The minimum-variance hedge reduced ES by 17.9% (block-bootstrap CI 6.2–32.4%) and variance by 14.9% (3.9–28.0%), and cut the maximum drawdown from 53.0% to 41.7% with an average notional of 11.1% of the BTC position (Table 3). It was held on 67% of bars and off whenever the estimated spot-vol covariance was positive, including on 8 of the 23 days in the unhedged ES tail. Net of funding (Figure 2), its P&L summed to +5.3% of BTC notional: the ten best days contributed +51% of notional and all other days −46%. The ten worst BTC days cost the unhedged book 74% of notional, and the hedge earned back 36%, 48% of that loss. The ES reduction was 6.3% in 2024, 10.0% in 2025 and 52.3% in 2026; without the best day it is 11.9%, without the five best 9.0%. Over 7- and 14-day horizons it is 22.2% and 32.4%, so the daily figure is not an artefact of the index lagging across day boundaries. Funding cost the hedge 1.4% of BTC notional a year: it paid 4.6% a year in 2024 and 4.3% in 2025 and received 5.6% in 2026.
The best day
On 5 February 2026 the hedge returned 20% of BTC notional while BTC fell by 14% (Figure 3). BVIV stood at 57 at midnight and 61 an hour before BTC broke below the ratchet’s VWAP band on the bar ending 15:15 UTC; it was 67 on that bar, 77 by 15:45 and peaked at 96 at 22:00. All rules entered the day with 558–609 contracts. As the index’s 15-minute moves exploded, the EWMA hedge ratio fell and the rules sold into the spike, the always-on hedge to 205 contracts by the close; the ratchet’s overlay kept it up to 20% larger.
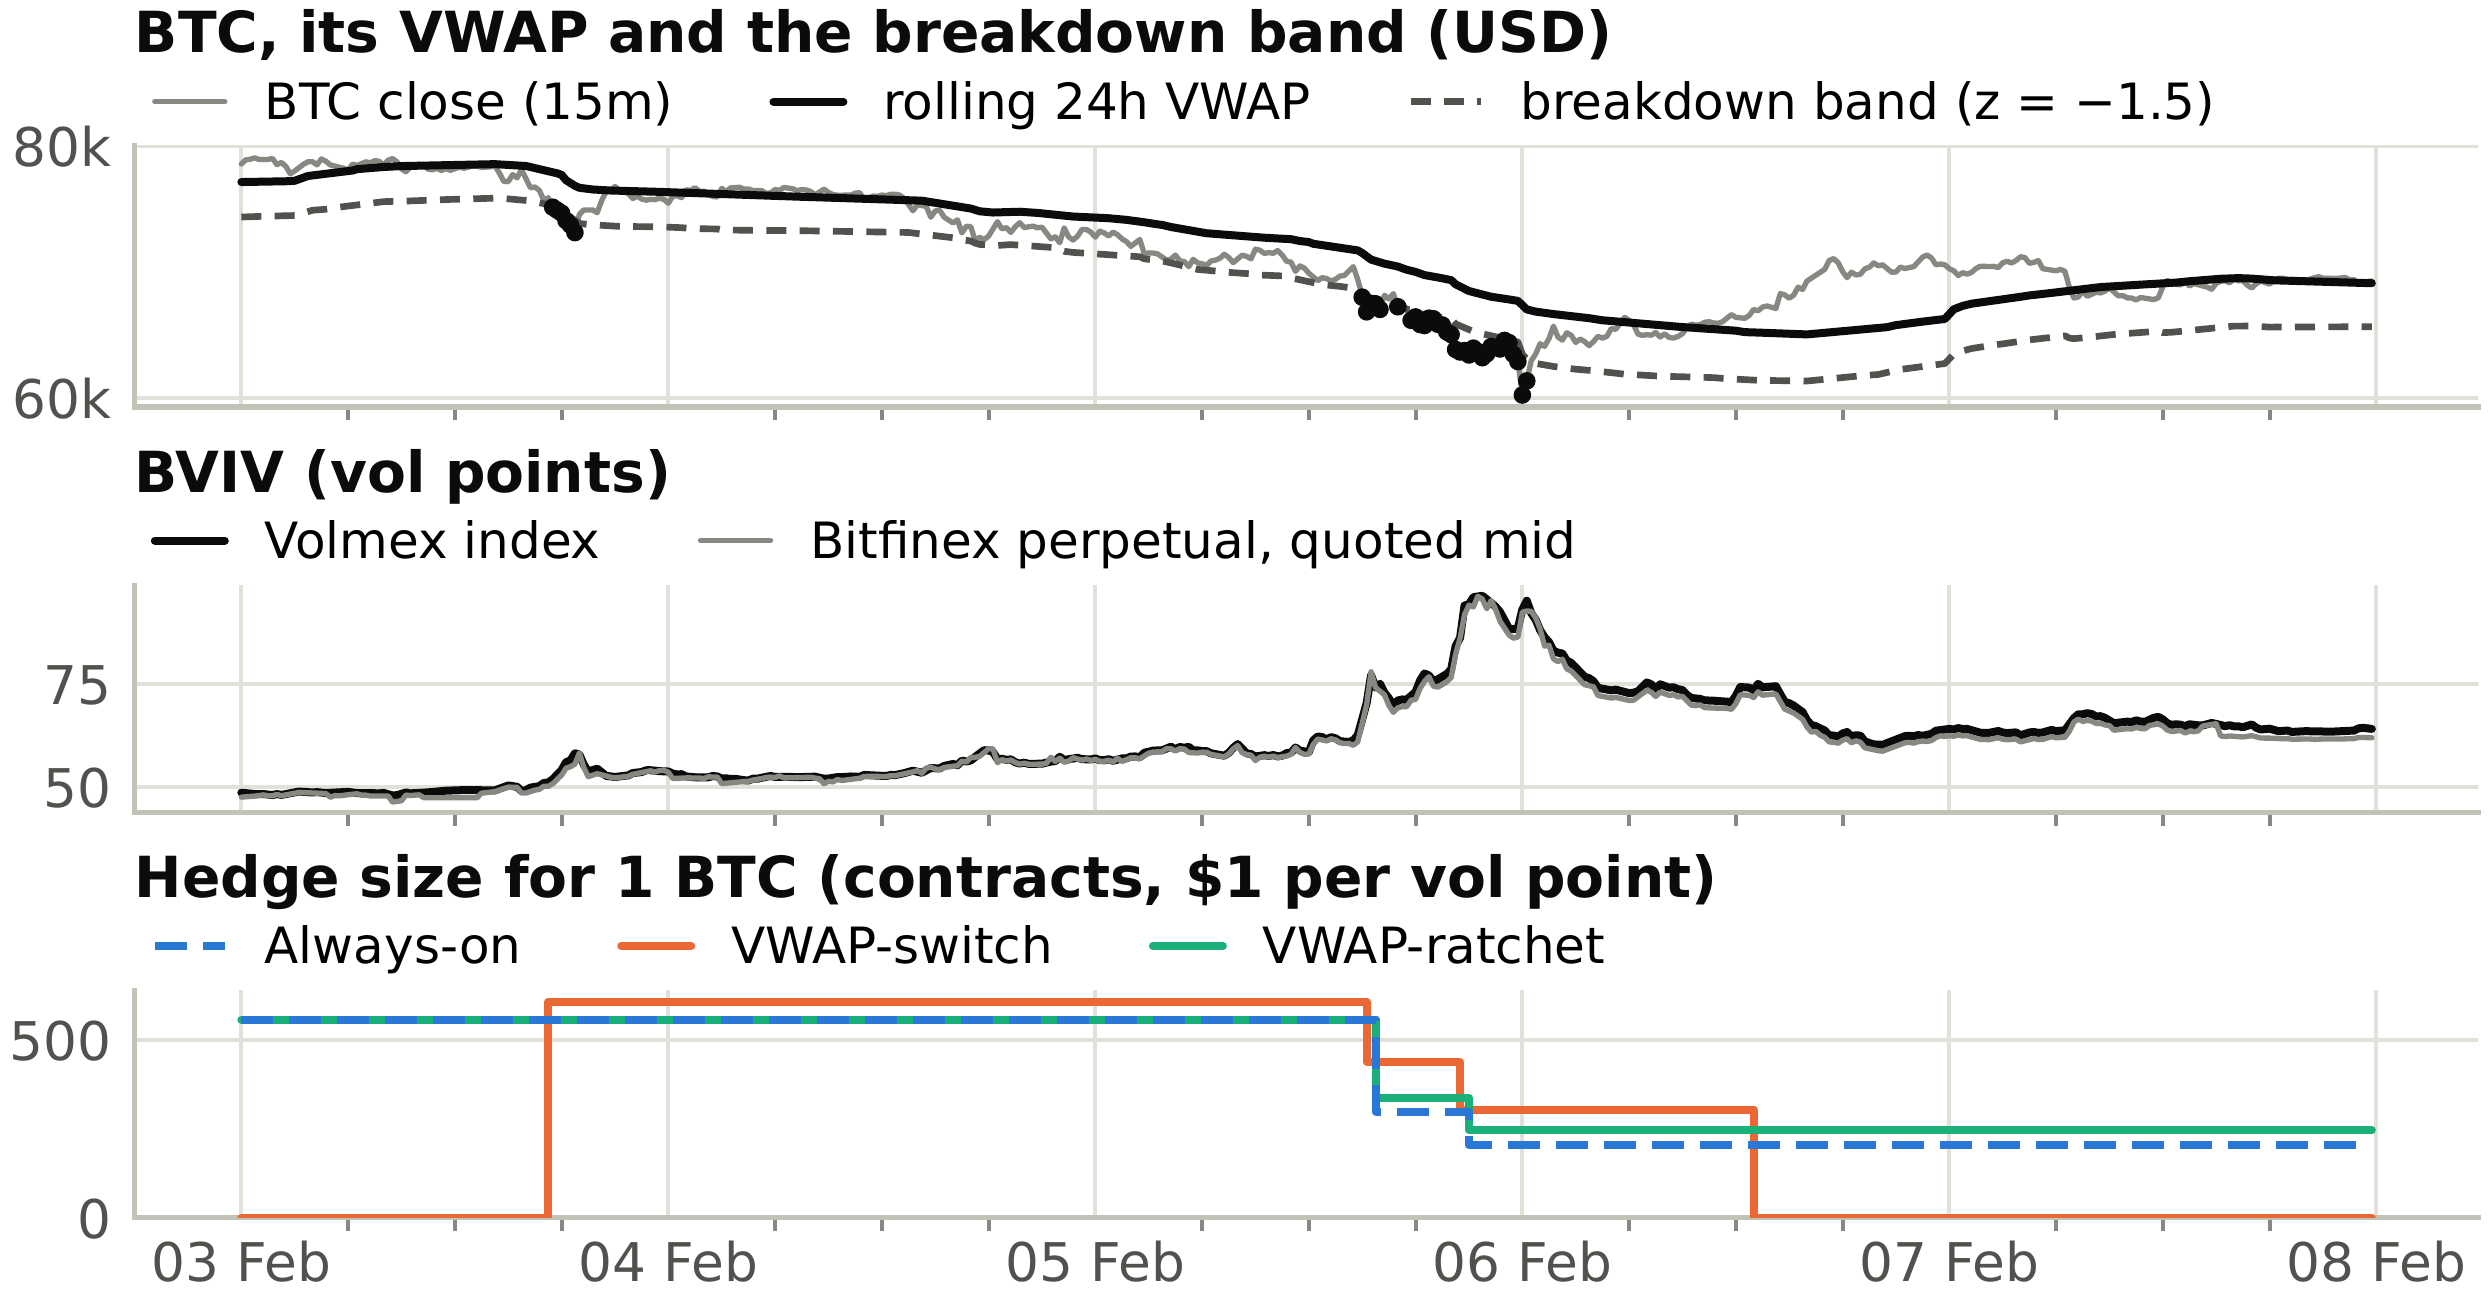
Figure 3: The best hedge day, 5 February 2026, and the days around it at 15-minute resolution (UTC, bar open times). Top: BTC, its rolling 24-hour VWAP and the ratchet’s breakdown band (dots: zt < zin). Middle: the Volmex index and the Bitfinex perpetual’s quoted mid. Bottom: hedge sizes of the three rules for a 1-BTC book.
| Variant | Always-on | 1.5× | Switch | Ratchet |
|---|---|---|---|---|
| Same-bar execution | 19.1 (+2.5) | 20.5 (+1.5) | 20.1 (+7.6) | 21.1 (+2.7) |
| Execution 1 hour after the signal | 16.0 (+0.4) | 17.3 (−1.9) | 14.1 (−3.0) | 18.3 (−2.0) |
| Execution 1 day after the signal | 12.6 (−1.4) | 11.2 (−5.3) | 10.3 (−4.3) | 13.2 (−3.0) |
| Fills at the quoted mid | 17.7 (+1.6) | 19.8 (+0.4) | 18.4 (+2.8) | 20.2 (+0.4) |
| Book costs (50 bp + fee) | 17.8 (+1.4) | 20.0 (+0.1) | 18.2 (−11.4) | 20.1 (+0.1) |
| No trading costs | 18.0 (+2.1) | 20.1 (+1.1) | 19.0 (+6.7) | 20.3 (+1.4) |
| Funding ignored | 17.9 (+3.3) | 20.0 (+3.0) | 18.7 (+1.3) | 20.3 (+3.6) |
| Perpetual BTC book | 18.0 (+1.9) | 20.1 (+0.8) | 18.9 (+1.5) | 20.3 (+1.0) |
Table 4: Live-data sensitivities, frozen rules, one change at a time to the baseline (execution one bar after the signal at the mark, 6+10 bp per side): ES reduction in % (hedge P&L net of funding and trading costs, % of BTC notional a year).
Timing adds little beyond exposure
The switch traded 32.3 times the BTC notional a year; its ES reduction differed from the always-on hedge’s by +0.92 points, not significantly (CI [−2.71, +3.54]), and at the book’s prices it would have paid 18.1% of notional a year in trading costs. The ratchet beat the always-on hedge by +2.37 points (CI [−0.22, +4.89]) and the 1.5× hedge by +0.17 (CI [−1.74, +2.35]). Its 129 placebos reduced ES by 19.9% on average, 90% of them between 19.1% and 20.4% (Figure 4, left), so +2.03 points of the edge are exposure and +0.34 timing; the ratchet beats 87% of its placebos (98% with same-bar fills, 71% at quoted mids). Notional explains only part of the exposure term on point estimates: scaled to the placebos’ notional (1.13×), the minimum-variance hedge reduces ES by 18.6%, 1.3 points less than the placebos, not significantly (CI [−0.73, +3.01]), whereas the ratchet’s overlay held permanently reduces it by 20.5%, as much as the best timed rule (20.4%; +0.26 points against the selected ratchet, CI [−0.94, +1.81]), for 3.65% of notional a year against the ratchet’s 3.03%. Across the 72-rule grid, timing adds +6.68 points without a core hedge (rules beat a mean 97% of their placebos), +1.63 with half a core and +0.71 with the full core (83%; 10 of 24 rules beat at least 95%; right panel); for the strictest full-core rules (zin = −2, half-lives up to two days) timing is 51–84% of the edge. VWAP breakdowns time protection far better than chance when nothing else is held, but they flag a sell-off already under way, and a core hedge captures most of their value.
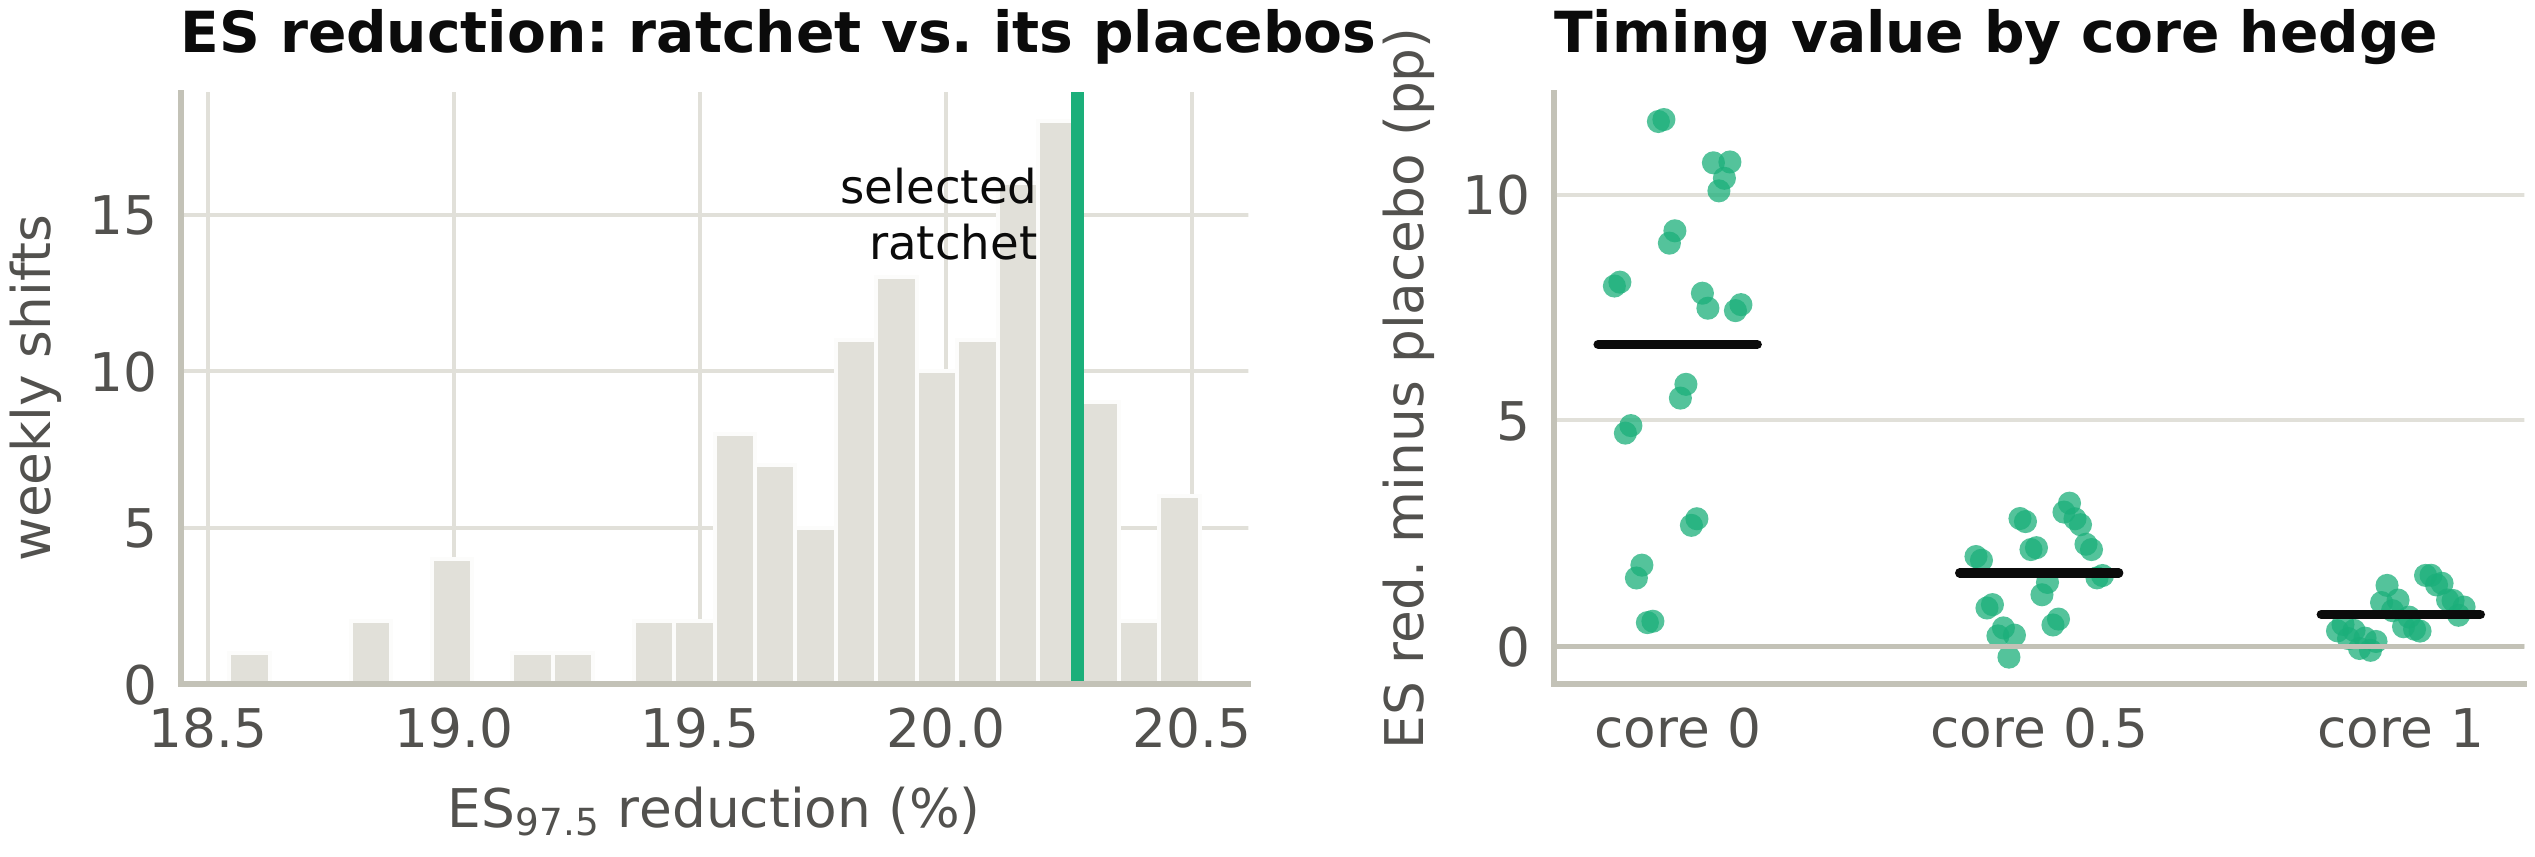
Figure 4: Timing placebos on live data. Left: ES reduction of the selected ratchet (line) against its 129 weekly circular shifts of its triggers. Right: timing value of each of the 72 ratchet configurations (ES reduction minus the mean over 64 two-weekly shifts) by core size; bars mark the means.
Execution and capacity
Costs, funding and fills at quoted mids barely move the ES reductions, which are dominated by crash days (Table 4). Speed matters most: same-bar execution would raise the always-on ES reduction to 19.1%, while executing one hour or one day after the signal lowers it to 16.0% and 12.6%. Capacity binds. When held, the hedge of one bitcoin was a median 248 contracts, against a median open interest of 103 on those bars, and exceeded the whole open interest on 61% of those bars (41% of all bars). On its five best days its peak was 1.7 to 23 times the day’s median open interest; on 5 February 2026 it traded 353 contracts while the market traded 18, and 30% of its trades fell on days without a single trade in the market. A book snapshot on 4 October 2026 shows market makers quoting size: one bitcoin’s hedge would have cost about 0.50% per side, half the 1.00% spread between the first levels of at least one contract (the top of the book held dust), and depth within 2.5% of the mid would have held the hedge of about 4 bitcoins.
6 The controlled experiment
One path cannot separate rules reliably, so we repeat the study in a simulated market calibrated to the stylised facts (Table 1, last column). Log-variance is the sum of a slow and a fast Ornstein–Uhlenbeck factor; the fast factor tracks a three-state hidden regime (calm, stress, euphoria) and receives EGARCH-type shocks (Nelson, 1991) whose signed loading on the return shock is −0.30/−0.60/+0.25 by regime; jumps cluster in stress, and volatility and volume are seasonal within the day and week. The index is the square root of the model’s closed-form expectation of 30-day average variance (a Feynman–Kac product over regime paths, lognormal in the factor shocks), scaled by a variance premium and perturbed by persistent sentiment. The perpetual’s funding is the one-bar drift transfer (exact over regimes and jumps, second order in the diffusive shocks) plus a carry of 6 vol points a year, so it offers no free lunch from mean reversion; unit tests check both expectations against brute-force simulation. The simulated index has neither the live index’s lag nor a funding cap, so the simulation does not speak to execution delay or the funding regime. Rules are selected on 48 training paths of 900 days and evaluated on 200 test paths.
Swipe for 7 more columns
| Rule | ES red. | Var red. | Max DD | Tail offset | Carry | Trading | Turnover | Time on |
|---|---|---|---|---|---|---|---|---|
| Always-on (MV) | 4.2 | 4.1 | 48.7 | 5.9 | 0.74 | 0.14 | 0.9 | 93 |
| Always-on, 1.5× | 4.9 | 3.1 | 49.5 | 8.8 | 1.11 | 0.20 | 1.3 | 93 |
| VWAP-switch | 2.8 | 1.9 | 50.9 | 4.9 | 0.38 | 3.94 | 24.6 | 35 |
| VWAP-ratchet | 4.9 | 3.9 | 48.9 | 7.8 | 0.96 | 0.23 | 1.4 | 98 |
| Ratchet, placebo timing | 4.9 | 3.8 | 48.7 | 7.7 | 0.96 | 0.24 | 1.5 | 98 |
Table 5: Simulation: hedging a long-BTC book on 200 test paths (medians; % unless stated). Columns as in Table 3, but with fills on the signal bar; Carry: funding carry paid (% of BTC notional a year); Time on: share of bars hedged. Placebo timing: the selected ratchet with circularly shifted triggers (mean of 5 shifts).
Findings
The best forecasts are the same as on live data: HAR-IV is best at one day (median QLIKE ratio 0.95) and seven days (0.89), the bias-corrected index at 30 days (0.85). The hedging gains are smaller (Table 5): the simulation has neither the 2026 crash cluster nor its strong spot-vol correlation (−0.59 against −0.21). The always-on hedge reduces ES by a median 4.2%. Averaged over paths, the paired difference to it is −1.67 points for the switch (CI [−2.00, −1.36]), unlike on live data, where the two cannot be told apart, and +0.53 for the ratchet (CI [+0.33, +0.72]), whose edge over its placebo is only +0.05, and a 1.5× hedge reaches the same ES reduction (4.9%): as on live data, the edge is mostly exposure. Across the grid (64 paths, 3 shifts per rule), timing adds +0.78 points without a core and +0.02 with the full core. In 96 further paths with common random numbers, where its edge is +0.66 points (CI [+0.39, +0.94]), it survives doubled or halved trading costs and a carry of 0 to 24 vol points a year (+0.63 to +0.67 points). It shrinks to +0.18 points under inverse leverage and to +0.34 when crashes cluster in stress, where the CIs include zero.
7 A credit hedge: short STRC
The instrument
STRC (“Stretch”) is the variable-rate perpetual preferred stock of Strategy Inc., whose assets are mostly bitcoin (MicroStrategy Incorporated (d/b/a Strategy), 2025). Sold at $90 in July 2025, it has traded on Nasdaq since 30 July 2025. Its $100 stated amount earns a cumulative dividend at a rate Strategy sets, initially with the stated aim of keeping the price near $100, and Strategy may redeem it at $101. The rate rose from 9% to 11.5% by March 2026 (Strategy Inc., 2026c) and to 12% for July 2026, when Strategy replaced the par target by a discretionary review (Strategy Inc., 2026b); since July the dividend has been paid twice a month (Strategy Inc., 2026d). STRC ranks behind Strategy’s debt and its STRF preferred and ahead of its other preferreds and its common stock. In the structural model of Merton (1974) such a junior claim is a riskless claim minus a put spread on the issuer’s assets, so a short position in STRC is long that put spread, and the dividend above the riskless rate is its premium, the price of selling catastrophe insurance (Coval et al., 2009). The analogy is loose: the dividend is discretionary, so a skipped payment is no default, and the issuer can raise the rate to restore the price. Strategy funds the dividends by selling common stock while it trades above the value of its bitcoin and by selling bitcoin below it (Strategy Inc., 2025), so the put should move into the money when a bitcoin decline closes that window. Since 22 June 2026 (first trades in our 0xArchive data) a perpetual on one STRC share, xyz:STRC, has traded on Hyperliquid, deployed by trade[XYZ] under HIP-3 and margined in USDC (trade[XYZ], 2026). Its oracle follows the external STRC price whenever a US session is open, including the post-market, an overnight ATS session and the pre-market; at weekends and on US holidays it is an average driven by the perpetual’s own order book, within ±10% bounds around a reference that can re-anchor once. It is not adjusted for dividends: a short collects the ex-dividend drop and pays the perpetual’s hourly funding instead.
Design
The rules keep the parameters frozen in Section 4, including the ratchet’s sizing by BVIV forecast cheapness; the instrument, cap, costs and execution change, and the hedge is short: the EWMA slope of BTC returns on STRC price changes sets its size whenever it is positive. Our STRC history is hourly. We observe STRC at the official open and close and at each hourly close (the official prints fill 2 sessions with incomplete hourly data), use only synchronous moves, with BTC returns over the same intervals, and fill a decision at the next observation; on the perpetual, the same hedge ratio trades at the next 15-minute mark. A Nasdaq short pays every dividend, a borrow fee of 1% a year (Interactive Brokers quoted 0.3–1.3% from July to October 2026; we have no quotes for June) and 1+2 bp per side; we credit no interest on the short-sale proceeds and ignore margin and recall. A perpetual short pays funding, the 9 bp taker fee and 9 bp of slippage, the median cost of selling the hedge into the perpetual’s book at the session closes. The cap carries the BVIV study’s risk budget over: half the BTC notional, scaled by how much more a dollar of the BVIV perpetual moved than a dollar of STRC (total return) over STRC’s first 30 calendar days (5.3×), gives 2.7 times the BTC notional, which the always-on hedge never reached. Hedging runs from 29 August 2025 to 2 October 2026, 275 US trading days, compared from close to close, so that a weekend BTC move and STRC’s Monday gap fall on the same day. Unlike the rules, the instrument was chosen after the June 2026 squeeze, which the issuer survived: the STRC results are a case study of one credit episode, not an out-of-sample test.
| Hedge | ES red. | Var red. | Max DD | Hedge P&L | Carry | Trading | Notional |
|---|---|---|---|---|---|---|---|
| Short STRC on Nasdaq, frozen rules | |||||||
| Always-on (MV) | 24.4 | 25.9 | 53.8 | −10.7 | 13.8 | 0.28 | 107 |
| Always-on, 1.5× | 21.6 | 26.6 | 55.2 | −15.9 | 19.6 | 0.31 | 156 |
| VWAP-switch | 21.0 | 19.2 | 54.4 | −0.7 | 3.8 | 5.82 | 45 |
| VWAP-ratchet | 24.4 | 26.0 | 53.8 | −11.4 | 14.5 | 0.29 | 116 |
| Always-on hedges, same trading days | |||||||
| Long BVIV perpetual | 48.6 | 33.3 | 42.2 | 12.2 | −1.6 | 0.25 | 21 |
| Half of each | 38.0 | 34.7 | 46.7 | 0.8 | 6.1 | 0.27 | 64 |
| From the perpetual’s listing (71 trading days), same hedge ratio | |||||||
| Short STRC on Nasdaq | – | 12.4 | – | −22.4 | 7.5 | 0.10 | 55 |
| Short xyz:STRC perpetual | – | 15.8 | – | −23.5 | 5.1 | 0.54 | 54 |
Table 6: Hedging a 1-BTC spot book by shorting STRC, 29 August 2025 to 2 October 2026 (275 US trading days; %, Notional in % of BTC). Columns as in Table 3; Hedge P&L is price P&L minus carry; Carry: dividends and borrow fee (Nasdaq) or funding (perpetual), % of BTC notional a year. Unhedged maximum drawdown: 53.1%. Middle panel: the BVIV hedge of Section 5 on the same trading days, alone and at half size next to half the STRC hedge. Bottom panel: the same hedge ratio on Nasdaq and on the perpetual from the latter’s listing; 71 days cannot estimate ES or drawdowns.
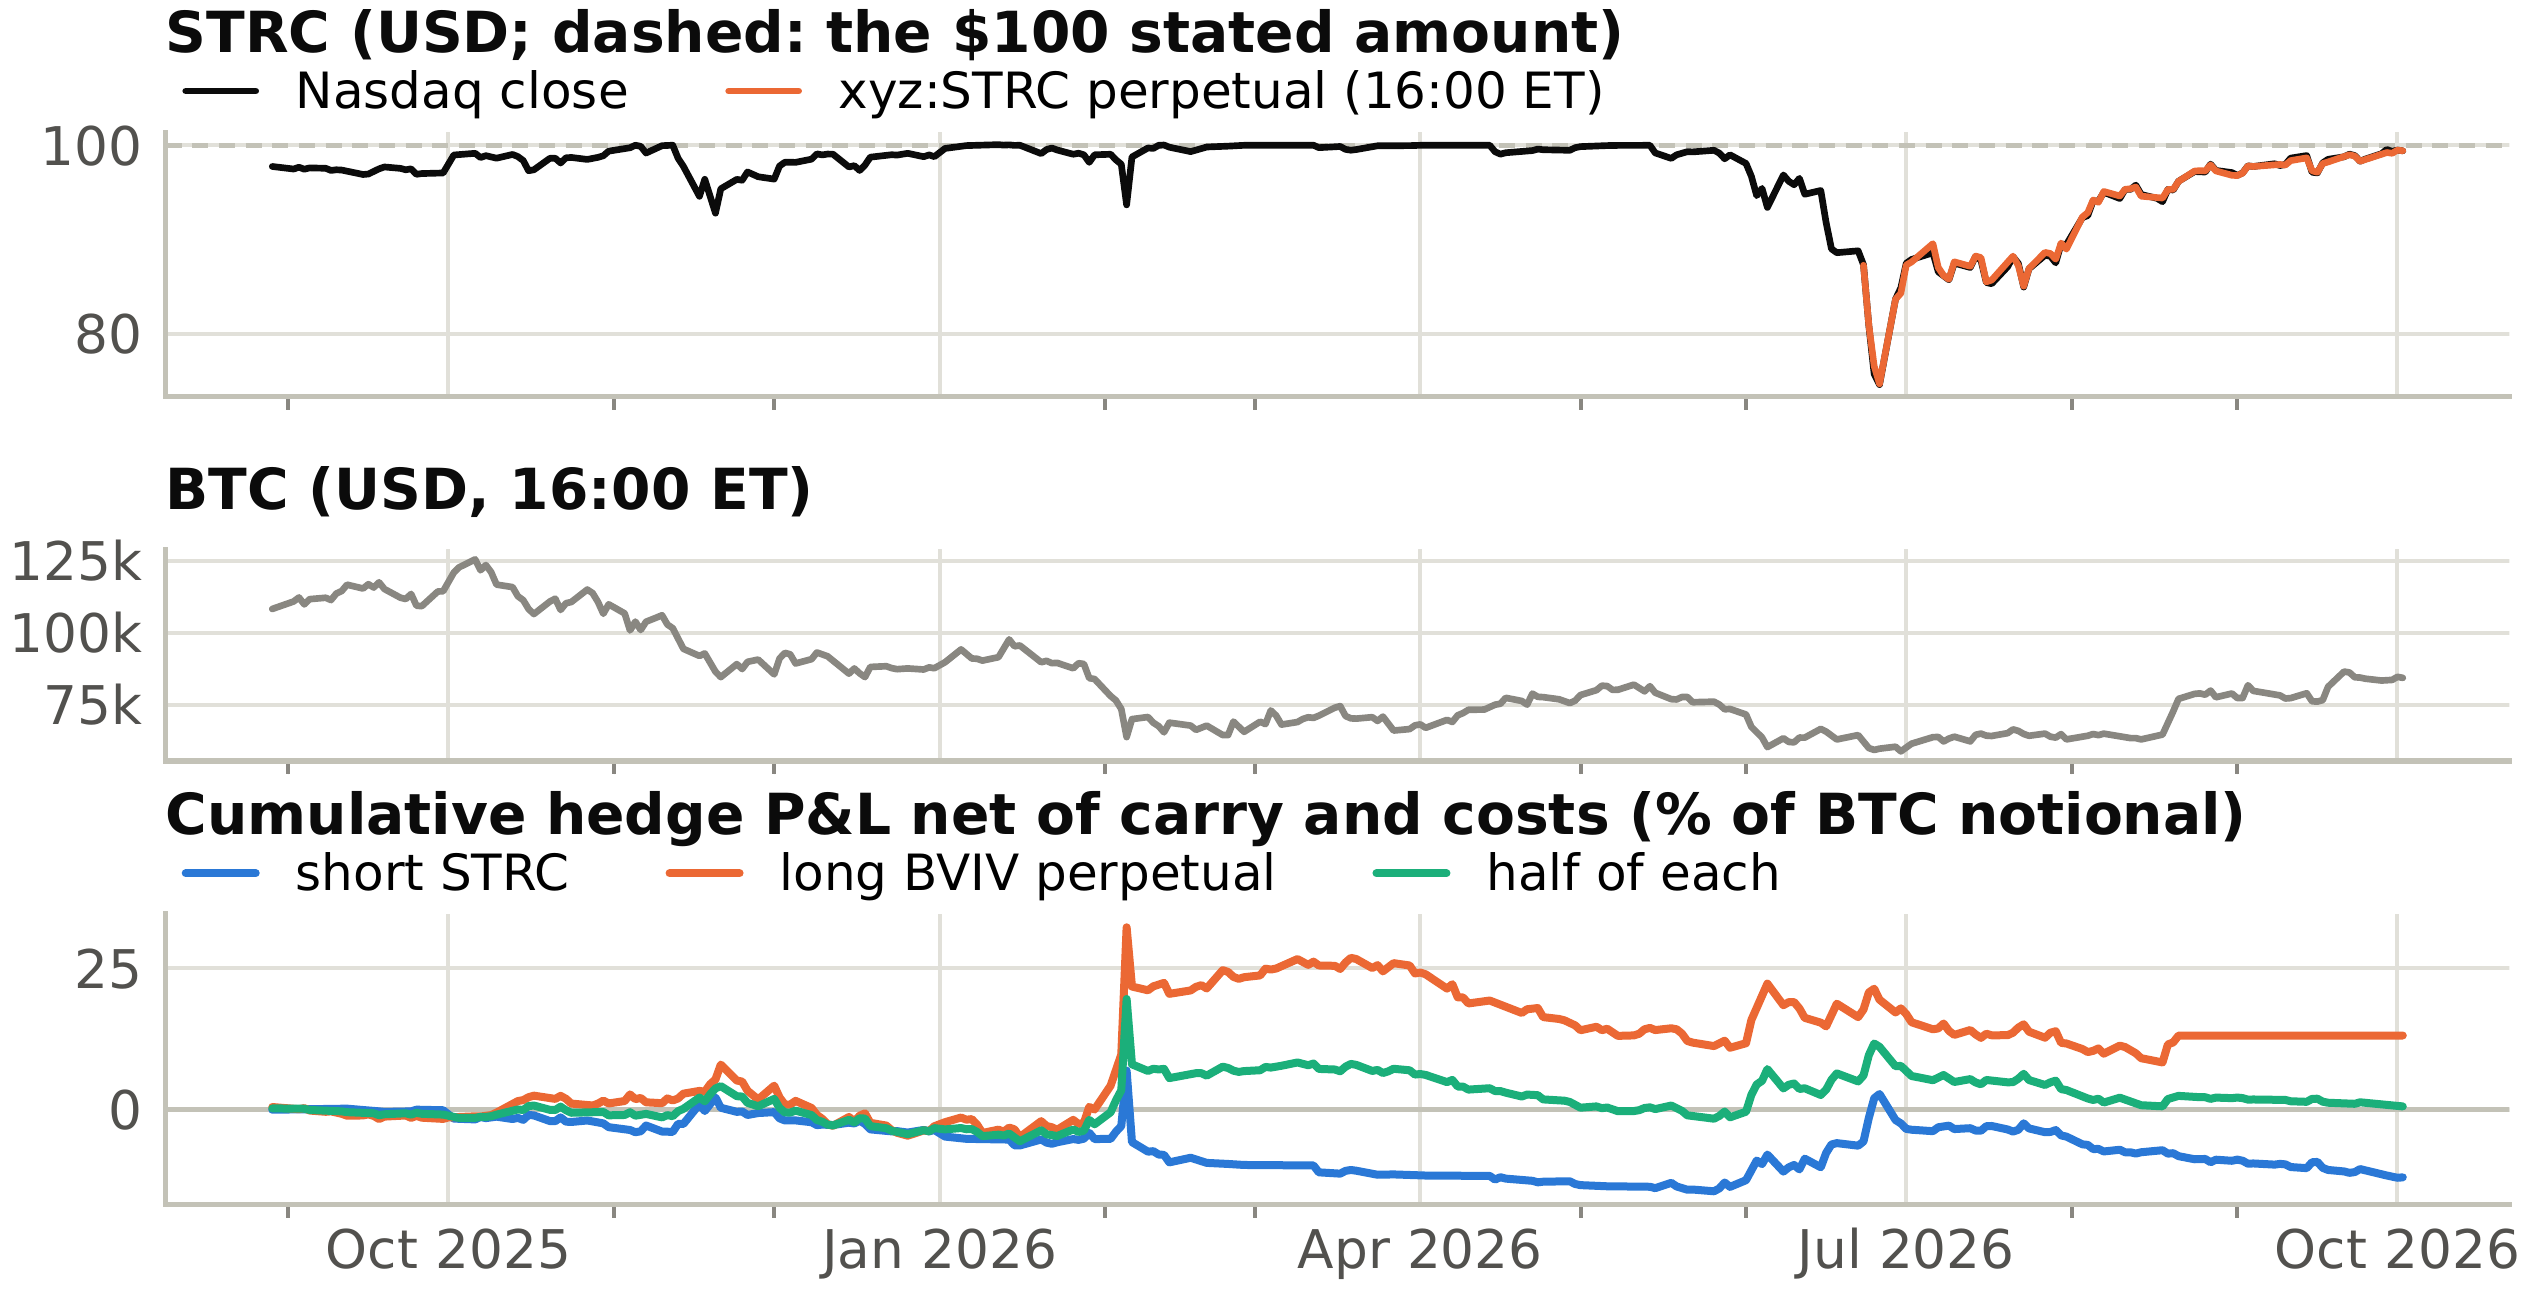
Figure 5: STRC on Nasdaq (official closes) and on the Hyperliquid perpetual, BTC, and the cumulative P&L, net of carry and trading costs, of the always-on short STRC hedge, the always-on long BVIV hedge and half of each, over US trading days.
Protection for days, not weeks
Shorting STRC reduced daily ES by 24.4% (CI [+2.2, +41.4]) and variance by 25.9% (CI [+11.0, +41.0]) at an average notional of 107% of the BTC position, but it cost 14.1% of BTC notional a year, almost all of it dividends, and left the maximum drawdown at 53.8% (Table 6). In normal times STRC is a weak BTC hedge: its daily correlation with BTC was 0.40 and its beta 0.19; on BTC’s worst 5% of days BTC fell 5.8% and STRC 1.3% on average. Most of the ES reduction comes from one day. On 5 February 2026 BTC fell 13.2% and STRC 4.4%, and the hedge, at 2.2 times the BTC notional at the previous close, earned 9.8% of it; without that day the ES reduction is 9.6%. The next day BTC rebounded 9.8% and STRC 5.4%, back towards par, and the hedge lost 12.6% (−0.5% over the week, against +21.7% for the BVIV hedge). Over 5 and 10 trading days the ES reduction falls to 17.8% and 3.2% (BVIV: 46.0% over 10 days). STRC paid more lastingly when a squeeze on Strategy’s funding (Van Straten, 2026b) drove it to a close of 74.57 on 26 June 2026. A convertible buyback had cut the cash reserve for dividends and interest to $871 million in May (Van Straten, 2026b), Strategy had begun to sell bitcoin to pay preferred dividends (Strategy Inc., 2026a), stablecoins backed by STRC traded below their pegs (Protos, 2026), and Strategy’s market value fell below that of its bitcoin (Van Straten, 2026a). STRC’s beta to BTC rose from 0.14 before June to 0.59 in June and fell back to 0.19 afterwards, as a put on the issuer’s balance sheet should. Over the 9 sessions from 15 June to the low the hedge earned 11.4% of BTC notional while the BTC book lost 5.9% (BVIV: +3.2%). When a new capital framework and a 12% rate lifted STRC by 12% on 29 June, the hedge lost 4.6%, and by 2 October, as STRC returned to par and BTC rallied (+30% of notional since 15 June), its P&L since 15 June was −3.3%: the reset and the rally made the payoff transient. The squeeze’s best hedge days were not among the BTC book’s worst 2.5% of days, so the ES reduction is unchanged without them (24.4%). Timing did not help: the ratchet’s ES reduction matched the always-on hedge’s (difference 0.0 points, CI [−1.6, +2.8]) and beat 73% of its 56 placebos, and against the always-on hedge the switch changed the ES reduction by −3.4 points (CI [−10.3, +1.1]) and the variance reduction by −6.7 (CI [−11.5, −2.8]). Over UTC days, which split weekend BTC moves from the Monday gap, the ES reduction is 21.3%; with a cap of one BTC notional, 15.2%; with same-bar fills, 22.6%.
The perpetual and the comparison with BVIV
Over the 71 sessions from 24 June 2026, the perpetual short paid funding of 9.4% of its notional a year, against 13.6% in dividends and borrow fee for the Nasdaq short with the same hedge ratio; the gap of 4.3 points is about the riskless rate, which the perpetual’s funding should net out of the dividend and which a Nasdaq short earning interest on its proceeds would recoup. The market’s average was lower (5.3% a year paid by shorts since the listing) because longs paid in late June (21% annualised), when the hedge was small, and shorts paid 18% in September. The hedge reduced variance by 15.8% on the perpetual and 12.4% on Nasdaq (difference CI [−0.8, +9.8]) at 5.6% against 7.6% of BTC notional a year; its ratio updates only at Nasdaq observations, so it never traded at a weekend. From each Nasdaq close to the next open, the perpetual’s move tracked the opening gap with correlation 0.96 (71 nights), but on weeknights its oracle is the extended-hours STRC price that a Nasdaq short can also trade (Barclay and Hendershott, 2003). Over the internal weekend window the perpetual moved only 2.2% on the weekend before 29 June 2026, when STRC’s Monday gap was 9.1%, and on the other 11 weekends the two were barely correlated (0.25); its bounds were never tested. For a small book capacity does not bind: STRC traded a median $129m a day on Nasdaq and the perpetual $0.9m, and one bitcoin’s hedge, a median $29k, was 0.3% of the perpetual’s open interest. The risk lies in the venue: the market is isolated-margin only and has no backstop liquidator, so when longs are liquidated in a squeeze, profitable shorts, ranked by profit and leverage, can be auto-deleveraged exactly when the hedge pays (trade[XYZ], 2026; Chitra, 2025). On the same trading days, which fall mostly in 2026, when the BVIV hedge cut ES by 52.3% (Section 5), it reduced ES by 48.6% (38.5% without 5 February; STRC minus BVIV: CI [−33.0, −13.9]) and variance by 33.3% (CI of the difference [−20.6, +5.3]), while carry plus trading came to −1.4% a year. The two hedges’ daily P&L correlated at 0.72 (0.43 without 5 and 6 February): both pay when BTC falls, BVIV in fast crashes and STRC most when a prolonged decline strains the issuer’s funding. Half of each reduced ES by 38.0% and variance by 34.7% (half minus BVIV: CI [−6.0, +8.4]) at 6.3% a year.
8 Limitations and conclusion
The live sample is one path of 914 days (275 trading days with a single credit episode for STRC), and the hedge’s gains rest on a few crashes in 2026 (without the five best hedge days the ES reduction falls from 17.9% to 9.0%), which the bootstrap quantifies but cannot remove. Fills at the mark plus costs are a benchmark for small books: on its best days the market could not have absorbed even a 1-BTC hedge, and we observe the order book only once, after the sample. The gains also assume solvent shorts through a 70% intraday rise of the index and a stable USDt; we model neither margin, liquidation and auto-deleveraging nor venue failure. For STRC we model neither the perpetual’s USDC collateral, nor its deployer’s control of the weekend oracle, halts and settlement under HIP-3, nor the venue’s exclusion of US persons (trade[XYZ], 2026), for whom only the Nasdaq short is available. Oracle risk (Hyperliquid, 2026) and algorithmic flow at the 15-minute boundary (Kim and Hansen, 2026) argue for working orders inside the bar by VWAP slicing (Berkowitz et al., 1988; Konishi, 2002; Białkowski et al., 2008).
Five lessons follow. (1) HAR augmented with implied variance is the best one-day BTC volatility forecast, significantly so over the full window and in 2025 but not since the perpetual’s listing; at a week HAR-IV and at a month the bias-corrected index lead HAR, not significantly. (2) A minimum-variance BVIV hedge cut tail risk by 17.9% over 2024–26, mostly through a few crashes with spiking implied volatility in 2026. Holding beats switching on costs and in the simulation; on live data the two cannot be told apart. (3) Its price is funding, which on Bitfinex is capped, volatile and on average paid by longs (24 vol points a year), although they received it in early 2026; its limits are execution speed and capacity. (4) A 15-minute VWAP breakdown is real but secondary information: without a core hedge it beats random timing, but with one, on average 66% of a ratchet’s edge is extra exposure, which holding its overlay permanently delivers too; timing adds +0.34 points for the frozen rule and +0.71 across the full-core grid; intraday timing rules should face such placebos before they earn their complexity. (5) Shorting STRC protects for days, not weeks: STRC falls with BTC on a crash day but returns to par, so its tail-risk reduction fades within two weeks; it paid most when Strategy’s funding was squeezed in June 2026, when its beta to BTC quadrupled. Its dividend makes it costly on Nasdaq unless the short earns interest on its proceeds; its perpetual nets that interest out, trades around the clock, but exposes a profitable short to auto-deleveraging.
Use of generative tools
AI assistants (Claude, Anthropic) supported this work: in searching the literature, in writing and testing code, in cross-checking results and in drafting and editing the text. The research question, the design of the study and the interpretation of the results are the author’s; the author directed the work, reviewed its results and takes full responsibility for the content of this paper.
References
- Damien Ackerer, Julien Hugonnier, and Urban Jermann. Perpetual futures pricing. Mathematical Finance, 36(3):481–499, 2026. doi: 10.1111/mafi.70018.
- Carol Alexander and Arben Imeraj. The Bitcoin VIX and its variance risk premium. Journal of Alternative Investments, 23(4):84–109, 2021. doi: 10.3905/jai.2020.1.112.
- Carol Alexander, Dimitris Korovilas, and Julia Kapraun. Diversification with volatility products. Journal of International Money and Finance, 65:213–235, 2016. doi: 10.1016/j.jimonfin.2016.03.002.
- Caio Almeida, Maria Grith, Ratmir Miftachov, and Zijin Wang. Risk premia in the Bitcoin market. arXiv preprint 2410.15195, revised August 2025, 2024. URL https://arxiv.org/abs/2410.15195.
- Torben G. Andersen and Tim Bollerslev. Intraday periodicity and volatility persistence in financial markets. Journal of Empirical Finance, 4(2–3):115–158, 1997. doi: 10.1016/S0927-5398(97)00004-2.
- Torben G. Andersen, Tim Bollerslev, Francis X. Diebold, and Paul Labys. Modeling and forecasting realized volatility. Econometrica, 71(2):579–625, 2003. doi: 10.1111/1468-0262.00418.
- Kadir Gökhan Babaoğlu. Volmex implied volatility indices. White paper, Volmex Labs, version of 8 July, 2026. URL https://volmex.finance/papers/Volmex-IV-paper.pdf.
- David H. Bailey, Jonathan M. Borwein, Marcos López de Prado, and Qiji Jim Zhu. Pseudo-mathematics and financial charlatanism: The effects of backtest overfitting on out-of-sample performance. Notices of the American Mathematical Society, 61(5):458–471, 2014. doi: 10.1090/noti1105.
- Michael J. Barclay and Terrence Hendershott. Price discovery and trading after hours. Review of Financial Studies, 16(4):1041–1073, 2003. doi: 10.1093/rfs/hhg030.
- Dirk G. Baur and Thomas Dimpfl. Asymmetric volatility in cryptocurrencies. Economics Letters, 173:148–151, 2018. doi: 10.1016/j.econlet.2018.10.008.
- Lykke Ø. Bergsli, Andrea F. Lind, Peter Molnár, and Michał Polasik. Forecasting volatility of Bitcoin. Research in International Business and Finance, 59:101540, 2022. doi: 10.1016/j.ribaf.2021.101540.
- Stephen A. Berkowitz, Dennis E. Logue, and Eugene A. Noser, Jr. The total cost of transactions on the NYSE. Journal of Finance, 43(1):97–112, 1988. doi: 10.1111/j.1540-6261.1988.tb02591.x.
- Jędrzej Białkowski, Serge Darolles, and Gaëlle Le Fol. Improving VWAP strategies: A dynamic volume approach. Journal of Banking & Finance, 32(9):1709–1722, 2008. doi: 10.1016/j.jbankfin.2007.09.023.
- Tim Bollerslev. Generalized autoregressive conditional heteroskedasticity. Journal of Econometrics, 31(3):307–327, 1986. doi: 10.1016/0304-4076(86)90063-1.
- Tim Bollerslev. A conditionally heteroskedastic time series model for speculative prices and rates of return. Review of Economics and Statistics, 69(3):542–547, 1987. doi: 10.2307/1925546.
- Elie Bouri, Georges Azzi, and Anne Haubo Dyhrberg. On the return-volatility relationship in the Bitcoin market around the price crash of 2013. Economics: The Open-Access, Open-Assessment E-Journal, 11(2017-2), 2017. doi: 10.5018/economics-ejournal.ja.2017-2.
- Peter Carr and Liuren Wu. Variance risk premiums. Review of Financial Studies, 22(3):1311–1341, 2009. doi: 10.1093/rfs/hhn038.
- Tarun Chitra. Autodeleveraging: Impossibilities and optimization. arXiv:2512.01112, 2025. URL https://arxiv.org/abs/2512.01112.
- CME Group. CME Group announces first trades for new Bitcoin volatility futures. Press release, 5 June, 2026. URL https://www.cmegroup.com/media-room/press-releases/2026/6/05/cme_group_announcesfirsttradesfornewbitcoinvolatilityfutures.html.
- Fulvio Corsi. A simple approximate long-memory model of realized volatility. Journal of Financial Econometrics, 7(2):174–196, 2009. doi: 10.1093/jjfinec/nbp001.
- Joshua D. Coval, Jakub W. Jurek, and Erik Stafford. Economic catastrophe bonds. American Economic Review, 99(3):628–666, 2009. doi: 10.1257/aer.99.3.628.
- Kresimir Demeterfi, Emanuel Derman, Michael Kamal, and Joseph Zou. A guide to volatility and variance swaps. Journal of Derivatives, 6(4):9–32, 1999. doi: 10.3905/jod.1999.319129.
- Deribit. DVOL – Deribit implied volatility index. Deribit Insights, exchange documentation, 2021. URL https://insights.deribit.com/exchange-updates/dvol-deribit-implied-volatility-index/.
- Francis X. Diebold and Roberto S. Mariano. Comparing predictive accuracy. Journal of Business & Economic Statistics, 13(3):253–263, 1995. doi: 10.1080/07350015.1995.10524599.
- Louis H. Ederington. The hedging performance of the new futures markets. Journal of Finance, 34(1):157–170, 1979. doi: 10.1111/j.1540-6261.1979.tb02077.x.
- Omkar Godbole. Bitcoin volatility index’s correlation with price flips positive, boosts appeal of bullish call options. CoinDesk, 4 April, 2023. URL https://www.coindesk.com/markets/2023/04/04/bitcoin-volatility-indexs-correlation-with-price-flips-positive-boosts-appeal-of-bullish-call-options.
- Omkar Godbole. Bitfinex derivatives users can now place bets on Bitcoin and Ether implied volatility. CoinDesk, 3 April, 2024. URL https://www.coindesk.com/markets/2024/04/03/bitfinex-derivatives-users-can-now-place-bets-on-bitcoin-and-ether-implied-volatility.
- Omkar Godbole. Volmex’s Bitcoin and Ether volatility futures top $10M in volume in first month as traders look beyond price. CoinDesk, 25 July, 2025a. URL https://www.coindesk.com/markets/2025/07/25/volmex-s-bitcoin-and-ether-volatility-futures-volume-tops-usd10m-in-first-month-as-traders-look-beyond-price.
- Omkar Godbole. Bitcoin’s ‘low volatility’ rally from $70K to $118K: A tale of transition from Wild West to Wall Street-like dynamics. CoinDesk, 11 July, 2025b. URL https://www.coindesk.com/markets/2025/07/11/bitcoin-s-record-rally-from-usd70k-to-usd118k-a-tale-of-transition-from-wild-west-to-wall-street-like-dynamics.
- Omkar Godbole. Perp futures linked to Volmex Bitcoin volatility index debut on Hyperliquid. CoinDesk, 21 September, 2026. URL https://www.coindesk.com/markets/2026/09/21/perp-futures-linked-to-bitcoin-vix-debut-on-hyperliquid.
- Peter Reinhard Hansen. A test for superior predictive ability. Journal of Business & Economic Statistics, 23(4):365–380, 2005. doi: 10.1198/073500105000000063.
- Peter Reinhard Hansen, Chan Kim, and Wade Kimbrough. Periodicity in cryptocurrency volatility and liquidity. Journal of Financial Econometrics, 22(1):224–251, 2024. doi: 10.1093/jjfinec/nbac034.
- Songrun He, Asaf Manela, Omri Ross, and Victor von Wachter. Fundamentals of perpetual futures. arXiv preprint 2212.06888, 2022.
- Lai T. Hoang and Dirk G. Baur. Forecasting Bitcoin volatility: Evidence from the options market. Journal of Futures Markets, 40(10):1584–1602, 2020. doi: 10.1002/fut.22144.
- Hyperliquid. HIP-3: Builder-deployed perpetuals. Hyperliquid documentation, 2026. URL https://hyperliquid.gitbook.io/hyperliquid-docs/hyperliquid-improvement-proposals-hips/hip-3-builder-deployed-perpetuals.
- Roni Israelov. Pathetic protection: The elusive benefits of protective puts. Journal of Alternative Investments, 21(3):6–33, 2019. doi: 10.3905/jai.2018.1.066.
- Leland L. Johnson. The theory of hedging and speculation in commodity futures. Review of Economic Studies, 27(3):139–151, 1960. doi: 10.2307/2296076.
- J.P. Morgan/Reuters. RiskMetrics – Technical Document. J.P. Morgan/Reuters, New York, 4th edition, 1996.
- Chan Kim and Peter Reinhard Hansen. The quarter-hour effect: Periodic algorithmic trading and return predictability in cryptocurrency futures. arXiv preprint 2607.09426, 2026.
- Hizuru Konishi. Optimal slice of a VWAP trade. Journal of Financial Markets, 5(2):197–221, 2002. doi: 10.1016/S1386-4181(01)00023-4.
- Lily Y. Liu, Andrew J. Patton, and Kevin Sheppard. Does anything beat 5-minute RV? A comparison of realized measures across multiple asset classes. Journal of Econometrics, 187(1):293–311, 2015. doi: 10.1016/j.jeconom.2015.02.008.
- Robert C. Merton. On the pricing of corporate debt: The risk structure of interest rates. The Journal of Finance, 29(2):449–470, 1974. doi: 10.1111/j.1540-6261.1974.tb03058.x.
- MicroStrategy Incorporated (d/b/a Strategy). Variable rate Series A perpetual stretch preferred stock: Prospectus supplement. Rule 424(b)(5) filing, U.S. Securities and Exchange Commission, dated 24 July, 2025. URL https://www.sec.gov/Archives/edgar/data/1050446/000119312525165531/d852456d424b5.htm.
- Jacob A. Mincer and Victor Zarnowitz. The evaluation of economic forecasts. In Jacob A. Mincer, editor, Economic Forecasts and Expectations: Analysis of Forecasting Behavior and Performance, pages 3–46. NBER, 1969.
- Daniel B. Nelson. Conditional heteroskedasticity in asset returns: A new approach. Econometrica, 59(2):347–370, 1991. doi: 10.2307/2938260.
- Whitney K. Newey and Kenneth D. West. A simple, positive semi-definite, heteroskedasticity and autocorrelation consistent covariance matrix. Econometrica, 55(3):703–708, 1987. doi: 10.2307/1913610.
- Andrew J. Patton. Volatility forecast comparison using imperfect volatility proxies. Journal of Econometrics, 160(1):246–256, 2011. doi: 10.1016/j.jeconom.2010.03.034.
- Dimitris N. Politis and Joseph P. Romano. The stationary bootstrap. Journal of the American Statistical Association, 89(428):1303–1313, 1994. doi: 10.1080/01621459.1994.10476870.
- Protos. Saylor distances himself from STRC-backed DeFi after stablecoin wobble. Protos, 10 June, 2026. URL https://protos.com/saylor-distances-himself-from-strc-backed-defi-after-stablecoin-wobble/.
- Strategy Inc. 2025 company update. Exhibit 99.2 to Form 8-K, U.S. Securities and Exchange Commission, 1 December, 2025. URL https://www.sec.gov/Archives/edgar/data/1050446/000119312525303157/d69948dex992.htm.
- Strategy Inc. Current report on Form 8-K: Bitcoin sales to fund distributions on preferred stock. U.S. Securities and Exchange Commission, report dated 30 May, 2026a. URL https://www.sec.gov/Archives/edgar/data/1050446/000119312526249768/mstr-20260530.htm.
- Strategy Inc. Current report on Form 8-K: Digital credit capital framework. U.S. Securities and Exchange Commission, 29 June, 2026b. URL https://www.sec.gov/Archives/edgar/data/1050446/000119312526286871/mstr-20260629.htm.
- Strategy Inc. Current report on Form 8-K: STRC dividend rate for March 2026. U.S. Securities and Exchange Commission, 2 March, 2026c. URL https://www.sec.gov/Archives/edgar/data/1050446/000119312526084264/mstr-20260228.htm.
- Strategy Inc. Current report on Form 8-K: Semi-monthly STRC dividends. U.S. Securities and Exchange Commission, report dated 14 June, 2026d. URL https://www.sec.gov/Archives/edgar/data/1050446/000119312526270366/d144149d8k.htm.
- Edward Szado. VIX futures and options: A case study of portfolio diversification during the 2008 financial crisis. Journal of Alternative Investments, 12(2):68–85, 2009. doi: 10.3905/JAI.2009.12.2.068.
- Tetsuya Takaishi. Time-varying properties of asymmetric volatility and multifractality in Bitcoin. PLoS ONE, 16(2):e0246209, 2021. doi: 10.1371/journal.pone.0246209.
- trade[XYZ]. Perpetuals documentation: Specifications, oracle price, discovery bounds, corporate actions, margining and auto-deleveraging. trade[XYZ] documentation, 2026. URL https://docs.trade.xyz/perpetuals.
- James Van Straten. Strategy’s valuation has fallen below the value of its bitcoin holdings. CoinDesk, 27 June, 2026a. URL https://www.coindesk.com/markets/2026/06/27/strategy-s-valuation-has-fallen-below-the-value-of-its-bitcoin-holdings.
- James Van Straten. How STRC lost its par: The timeline behind Strategy’s preferred-stock meltdown. CoinDesk, 20 June, 2026b. URL https://www.coindesk.com/markets/2026/06/20/how-strc-lost-its-par-the-timeline-behind-strategy-s-preferred-stock-meltdown.
- Robert E. Whaley. Trading volatility: At what cost? Journal of Portfolio Management, 40(1):95–108, 2013. doi: 10.3905/jpm.2013.40.1.095.
- A. Elizabeth Whalley and Paul Wilmott. An asymptotic analysis of an optimal hedging model for option pricing with transaction costs. Mathematical Finance, 7(3):307–324, 1997. doi: 10.1111/1467-9965.00034.
- Halbert White. A reality check for data snooping. Econometrica, 68(5):1097–1126, 2000. doi: 10.1111/1468-0262.00152.