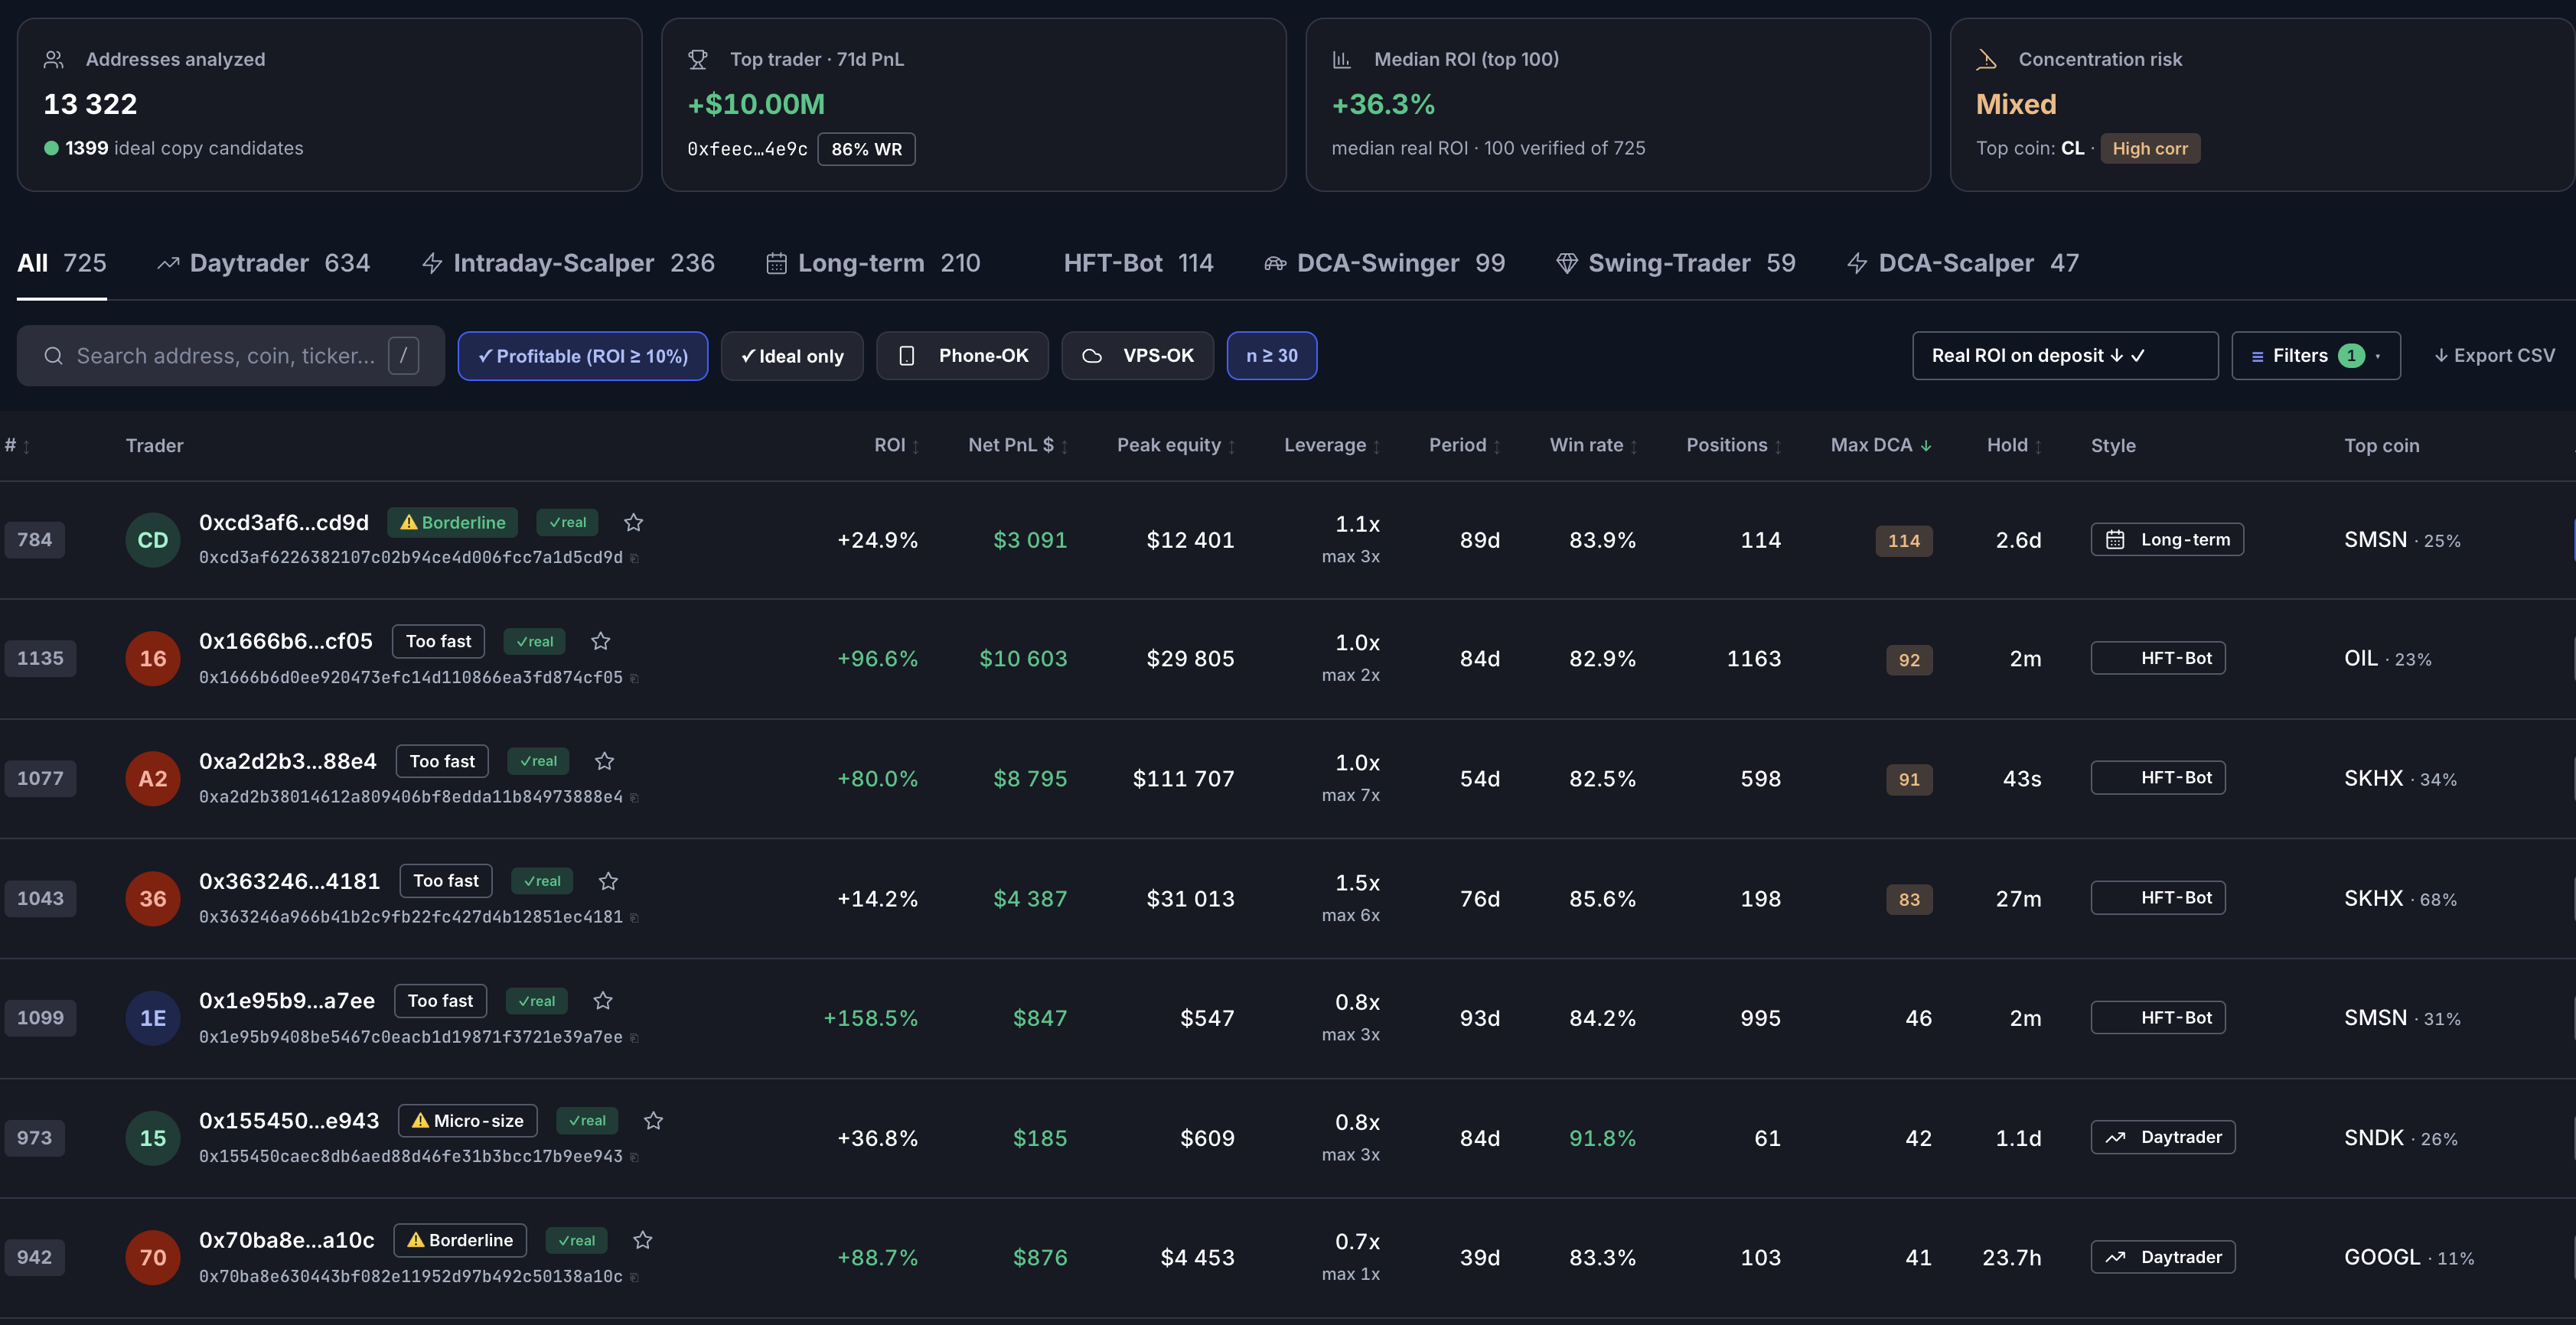
analyzed 3.4M hyperliquid HIP-3 positions solo with AI — top traders all do one thing
u/Borchello reconstructed 3.4M closed Hyperliquid HIP-3 positions and found that all of the top 50 traders were long only, half leaned hard on DCA, and holds ran 1 to 14 days.
185 traders passed the quality filters; the top 50 are shown. 3.4M closed positions, March 4 to May 14. Source: u/Borchello, via 0xArchive.
3.4MClosed HIP-3 positions reconstructed from 3.9M trades across 29k addresses.
75%Win rate of the standalone DCA backtest over 411 trades.
85%Share of those trades where DCA never triggered. It works as a safety net.
a year ago this kind of analysis needed a team — data engineer, analyst, quant, frontend. now its evenings of solo work with AI. decided to test it on a real question: who actually makes money on hyperliquid HIP-3 (perps on stocks/oil/gold) and what do they do differently.
pulled 3.9M trades, 29k addresses, 3.4M closed positions via 0xArchive (mar 4 → may 14). reverse engineered every open→close pair for real closed pnl. filtered for quality (winrate >70%, min 5 closes, min 3 coins, hold >1h). 185 traders passed, took top50.
what suprised me:
1. every single top trader is long only. all 50. each one has 92-100% of trades as longs. full shorts — nobody. zero. its all US tech in a multi-month uptrend, shorting was just burning cash.
2. DCA isnt optional, its THE strategy. half of top50 goes hard with DCA:
#3: $85k profit, near-perfect winrate on 118 positions, avg 73 DCA orders per pos
#6: 130 positions, avg 563 DCA per pos
#26: 2,496 positions, avg 874 DCA each. clearly a bot
play: enter, price goes against, keep adding, exit green. on US tech in uptrend prints money. on shitcoins u'd get nuked.
3. backtested the DCA logic standalone (anomaly detector + DCA at -5%/-10% + trailing stop). 411 trades: 75% wr, +5% avg, +2000% total. the kicker — in 85% of trades DCA never triggers, its a safety net for bad entries. not "average down forever", more like "give entry room to breathe".
4. tech concentration is insane. top tickers: AMD (18 traders), INTC (15), MU (14), SNDK (13). everyones trading the same 5-7 names. "diversifying across 10 traders" is fake — its all leveraged beta to nasdaq semis. SOXX rolls over → all 50 red simultaneously.
5. latency is not a thing. 54% of top50 have execution windows >1hr — can be replicated from ur phone. holds are 1-14 days, not seconds.
caveats: top50 picked over the same period i measured — survivorship bias is real, needs out-of-sample validation. some "100% wr" traders have wide confidence intervals at small n.
tldr: top hyperliquid HIP-3 traders are 100% long only, DCA into US tech, hold for days, phone-speed execution works. DCA is a safety net that fires ~15% of the time, not constant averaging down. all built solo over 2 weeks with AI — used to need a whole team.
The author's replies in the thread
u/Borchello added these notes on the findings and method in replies under the original post.
fair point lol, flagged it as a caveat too. but the part that suprised me wasnt that longs print in a bullrun — its zero shorts in top50. usually u find at least some even in bull markets.
plus the DCA thing — top traders mean-revert on dips (-5%/-10% adds), not ride momentum. counterintuitive for a "just buy bullrun" thesis
yeah u got it — but its not just "price drops, add more". the top guys actually scale in both directions — they add on the way down (-5%/-10% from entry) AND on the way up when momentum confirms. then take partial exits periodically as price extends. so its more like "pyramiding + averaging" combined, not pure DCA-down.
the bot-looking accounts (500+ adds) are doing this systematically — small ladders both sides + partial scales out every X%. most discretionary traders stop at 2-3 adds.
on tracking — didnt use the explorer, pulled raw fills from 0xArchive (s3 dump of all hyperliquid trades). every fill has order id + price + size + addr + time. so for each addr u group fills by order id to dedupe (one big market order can eat 50 book levels and look like 50 entries in raw fills — fixed by counting unique order ids).
TWAPs show up as series of small fills spaced over time from same addr. i was mislabeling some thin-book takers as DCA at first — counting unique order ids separated them from real adds.
yeah totally free. all hyperliquid data is public — u can pull raw fills from (s3 dump) or directly from the HL api. no paid feeds, no insider access.
i just used claude code to write the pipeline download → parse → reconstruct positions → build dashboards. honestly the hardest part wasnt the data, it was figuring out the right metrics and catching subtle bugs in pnl math (off by 1 sign somewhere and ur whole analysis is cope).
if u want to build ur own happy to point u to the right starting points
Get the next study by email
One email when we publish new Hyperliquid or Lighter research.