
An analysis of price discovery, informed flow, and predictive signals on trade.xyz's SP500 perpetual futures market on Hyperliquid.
This article is for educational and research purposes only. Nothing here constitutes investment advice. All findings are tested on a very limited sample set and have not been validated out-of-sample.
Thank you to our contributors, 0xArchive, SonarX, and Stacy Muur for their valuable insights and powering the data behind this research.
Abstract
On March 18th, 2026, trade.xyz launched the first officially licensed S&P 500 perpetual futures contract on Hyperliquid, in collaboration with Standard & Poor’s.
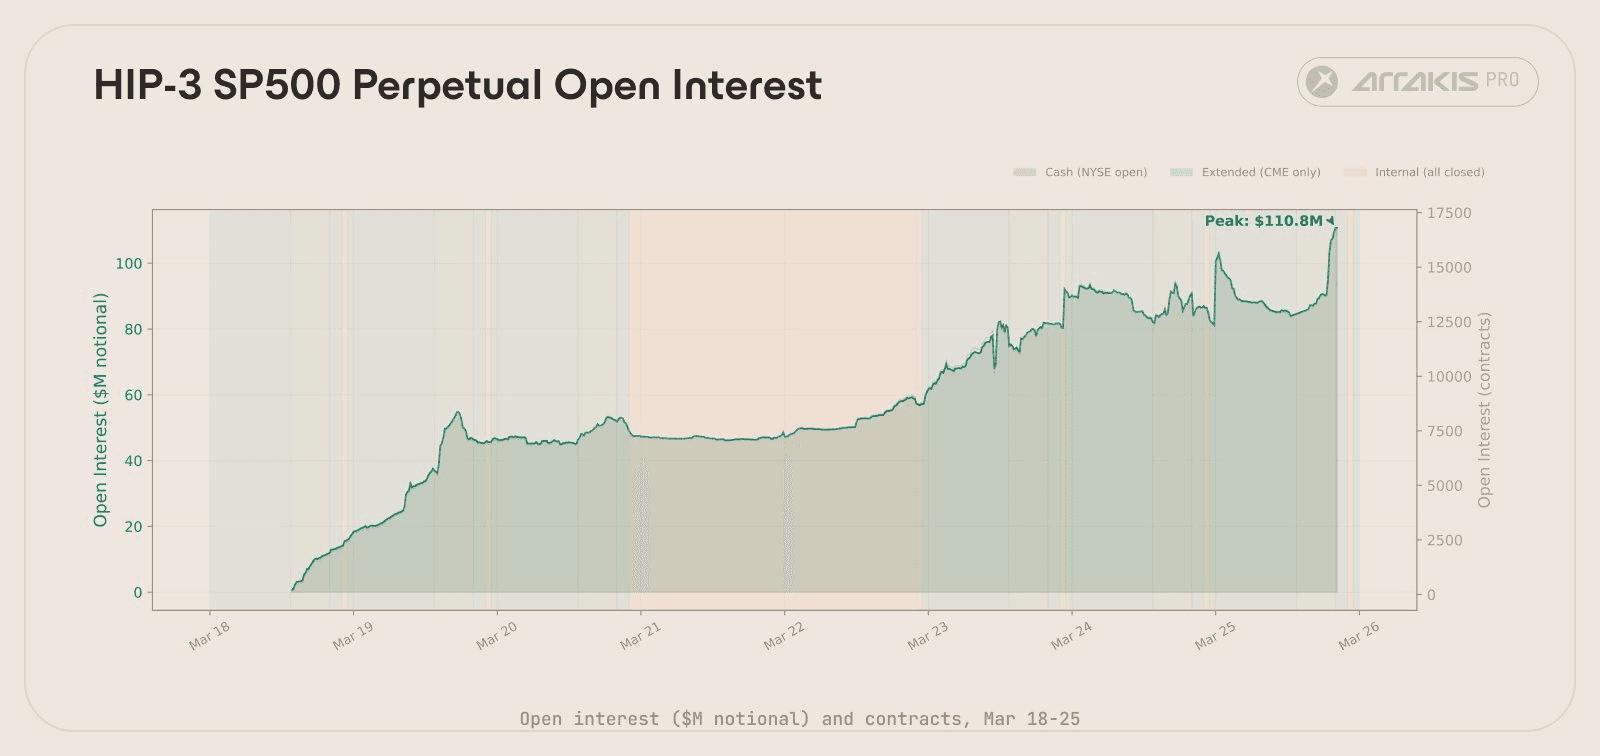
In its first week, the market traded over a billion in volume across 5,175 unique wallets, with peak open interest reaching $110.8M.
We analysed the microstructure of this market to test whether trading activity from it contains information that can accurately predict the near-term direction of S&P 500.
Two independent signals predict S&P 500 returns at 10-minute horizons with statistical significance (p<0.001). A subset of 147 wallets, representing just 3% of participants, trade with 79% directional accuracy against SPX. A composite signal built from their activity predicts the S&P direction 59.5% of the time (p=0.0035).
These findings are preliminary and the sample is small. But the statistical significance holds across multiple independent tests, pointing to something worth examining further.
The Market
Trade.xyz’s SP500 perpetual on Hyperliquid trades 24/7 with up to 50x leverage, priced against a Pyth oracle that tracks the S&P 500 index. During cash hours, the oracle tracks SPX with a median deviation of 2.56 bps.
The first week of trading (March 18-25, 2026):
| Metric | Value |
|---|---|
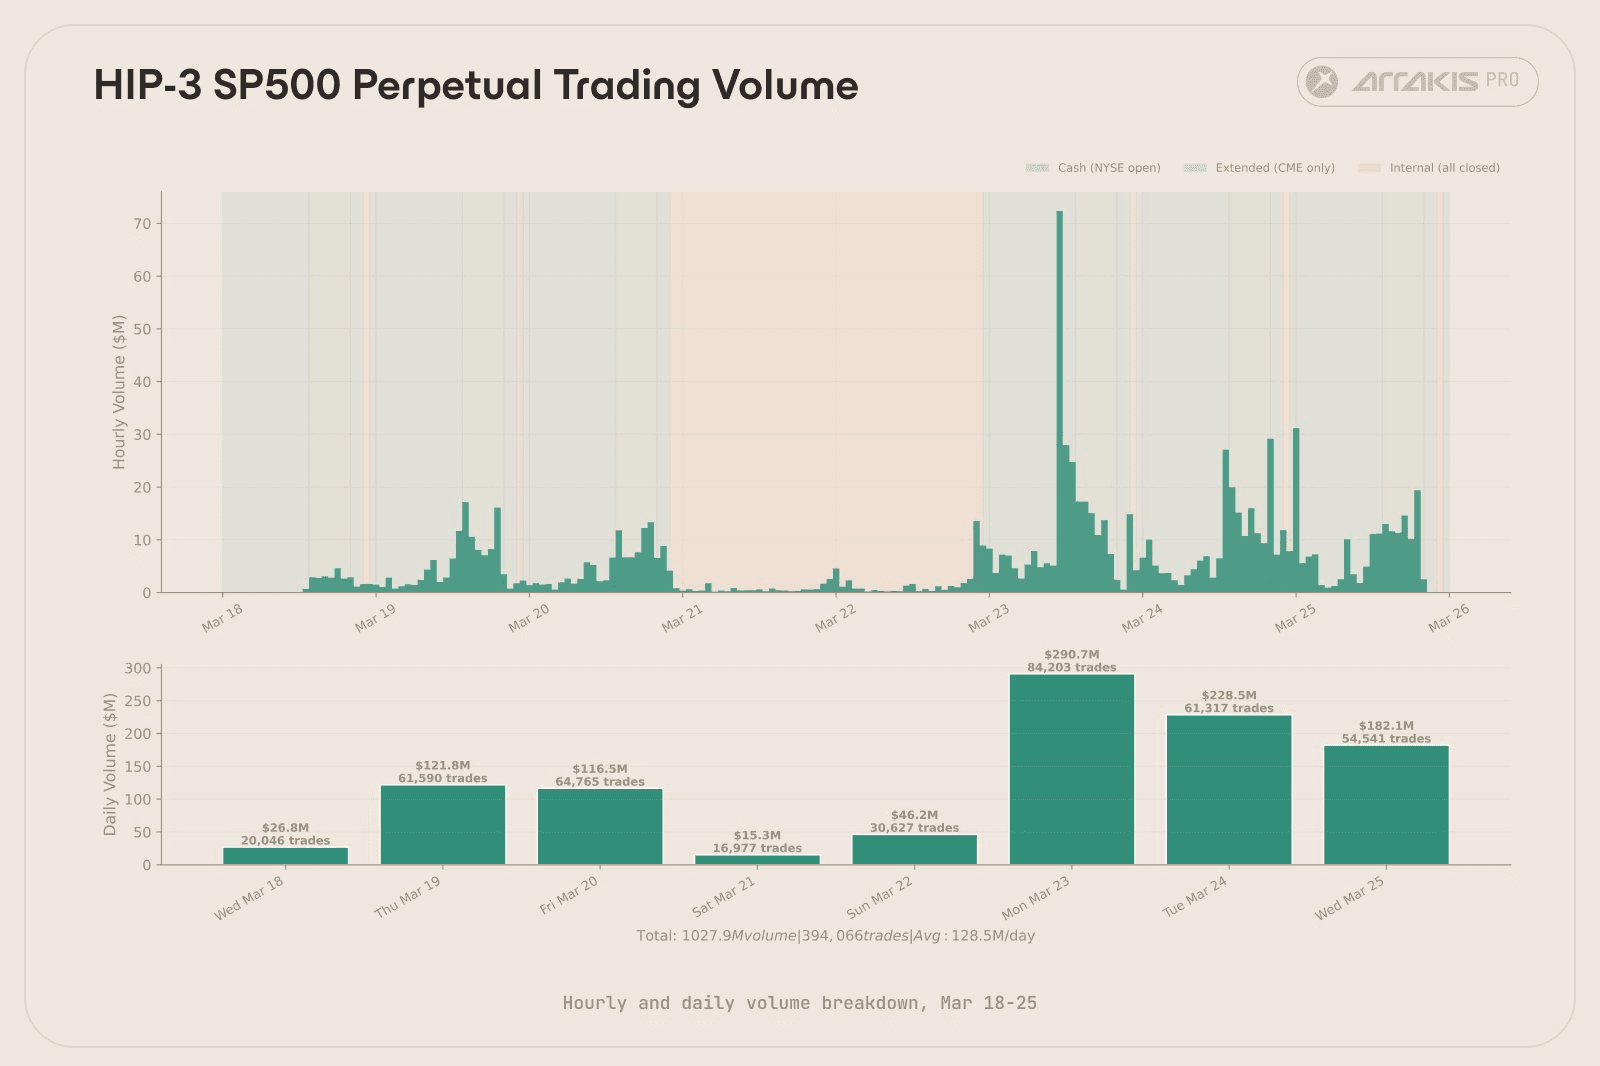
| Total volume | $1.03B |
| Total trades | 394,066 |
| Peak daily volume | $290.7M (Mar 23) |
| Peak open interest | $110.8M (16,807 contracts) |
| Average open interest | $58.1M |
| Unique wallets | 5,175 |
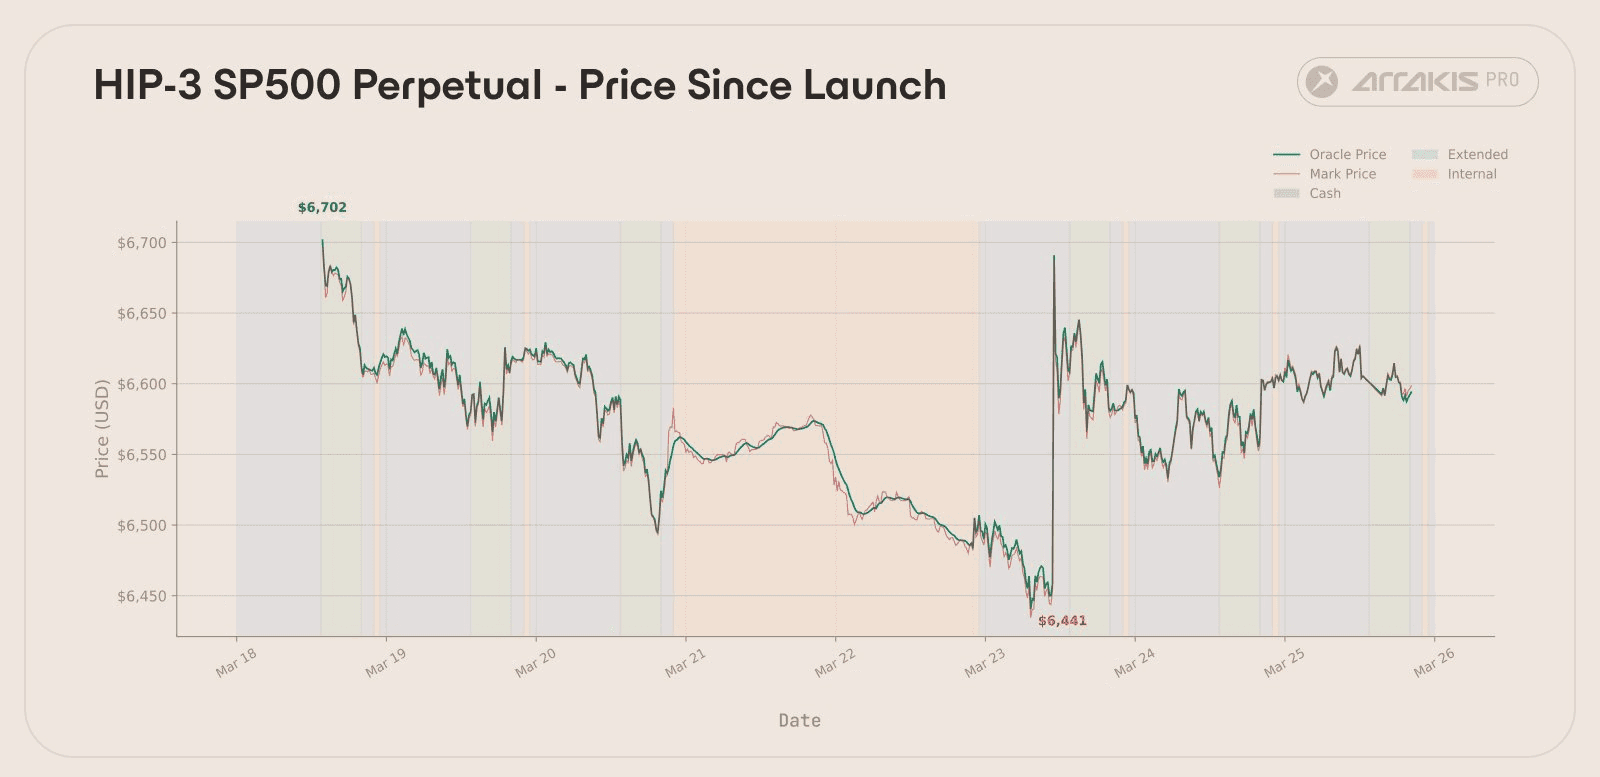
| Price range | $6,436 - $6,702 |
Volume grew roughly 10x from launch day ($27M) to March 23rd ($291M). The market is concentrated: the top 10 wallets account for 58% of volume, the top 50 for 73%. The median wallet traded $2,997 total across 5 fills.
A Case Study in Informed Flow
On March 23 at 11:05 UTC, roughly 2.5 hours before the NYSE open, the perp price jumped from $6,440 to $6,681 in five minutes. A +3.7% move. $27M in taker volume hit the book in that window, 86% on the buy side. Open interest dropped from 12,088 to 10,364 contracts as shorts were squeezed out.
A top buyer was the wallet 0x5aa6.....dc16 with 118 buy-side fills totaling $1.9M, all placed between 11:05 and 11:10 UTC.
At 11:23 UTC, Trump posted on Truth Social announcing a five-day postponement of military strikes against Iranian energy infrastructure, citing “very good and productive conversations” with Iran, indicating de-escalation of geopolitical risk. By this time, the buyer had already finished.
This wallet traded exclusively during extended hours and falls outside our cash-hours analysis below. But the episode illustrates why informed orderflow on a 24/7 leveraged market on the biggest equity index is worth studying.
Why Perpetual Futures Might Lead Spot
Perps attract short-term directional traders as leverage amplifies directional exposure: a trader who believes SPX will move up in the next 10 minutes can express that view at 50x on Hyperliquid, making even a small edge worth trading.
If enough informed traders act on their view via the perp before the same information is reflected in the spot market, the derivative should lead. This is a well-studied phenomenon in traditional markets where derivatives frequently impound information before the underlying spot market (Kawaller, Koch & Koch, 1987).
We tested this hypothesis by analysing whether trading patterns on this market contain information that predicts where the S&P 500 will be 10 minutes from now.
Methodology
We tested this across 6 NYSE cash sessions (March 18-25, 2026), totalling 2,184 matched 1-minute bars where both the perp and SPX were active. Signals are measured over a 5-minute lookback window.
Data sources: HIP-3 trade and orderbook data via 0xArchive and SonarX. SPX reference prices from yFinance 1-minute bars. All analysis restricted to cash hours with gap-cleaned forward returns.
Throughout the analysis, signals are evaluated by sorting observations into quintiles, five equal-sized buckets ranked from most bearish to bullish. Q1 is the bottom 20% (strongest bearish signal), Q5 is the top 20% (strongest bullish signal). We compare these extremes rather than averaging across all observations, because weak signals are primarily noise: a barely-positive basis shift carries little information. Focusing on the top and bottom quintiles isolates the moments where the signal is actually saying something.
For each signal, we ask: could this result have appeared by chance? We answer this with a p-value, if we ran the same analysis on purely random data, how often would we see an effect this large? A p-value below 0.05 means less than a 5% chance the result is a fluke. We use this threshold throughout as the bar for calling a signal statistically significant.
Signal 1: The Basis Spread
We define the basis here as the difference between the perp's mid price (midpoint of best bid and best ask) and the oracle price, expressed in basis points. We use mid price rather than mark price, since the mark price in HIP-3 is a composite of the oracle price and recent fill prices, so measuring its deviation from the oracle might introduce autocorrelation, as the two inputs are not independent.

The basis level itself is mostly structural. The market was sitting at a ~4.5 bps discount on average, reflecting cost of carry and risk premium. That level tells us about market structure, not short-term direction.
What is more indicative of directional movement is the change in bid basis over 5 minutes:

The reasoning
The oracle price reflects where SPX is. The mid price reflects where HIP-3 traders think it should be. When the mid pushes above the oracle faster than the oracle is moving (ΔBasis > 0), traders on HIP-3 are collectively bidding the contract above the index’s current level. They are pricing in a move the oracle hasn’t registered yet.
If they are right, SPX should follow.
Conversely, if ΔBasis < 0 means traders are selling the perp below the oracle, potentially pricing-in downside before SPX might get there. The change in basis strips out the structural discount and isolates the flow-driven component, the part that might actually carry directional information.
Results
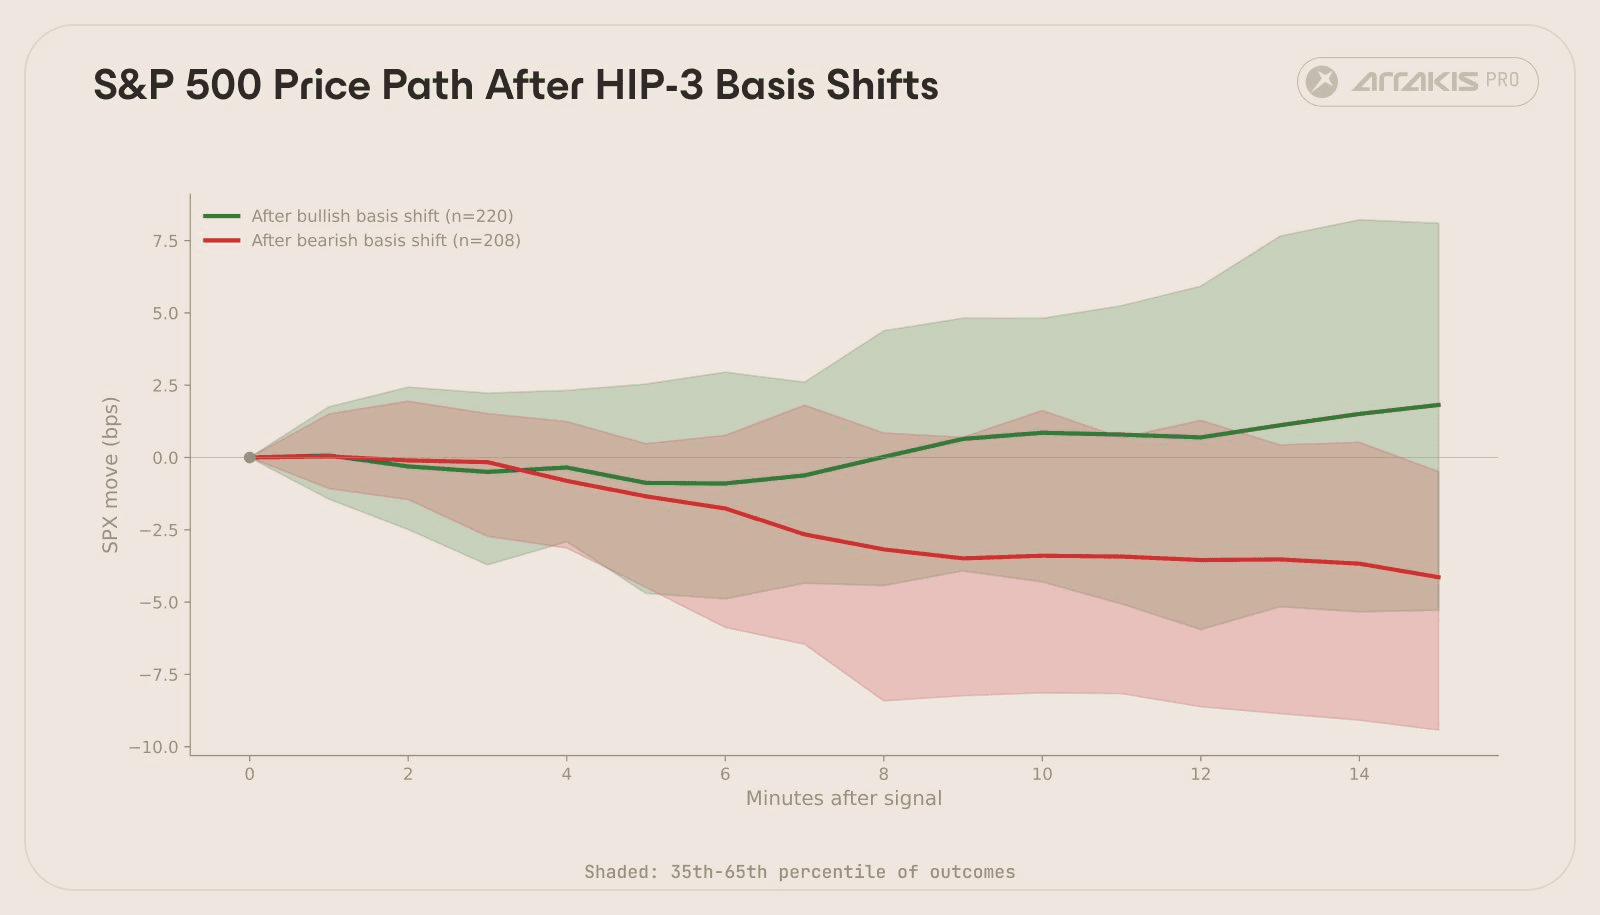
We sorted every 1-minute bar into quintiles based on $\Delta\text{basis}_{5m}$, then measured what SPX did over the next 10 minutes. Top quintile (strongest bullish basis shifts) versus bottom quintile (strongest bearish shifts):
| Metric | Q5 (bullish shift) | Q1 (bearish shift) | Gap | p-value |
|---|---|---|---|---|
| SPX 10m forward return | +1.15 bps | -3.51 bps | +4.66 bps | 0.0003 |
When the perp is bid up relative to the oracle, SPX tends to follow upward over the next 10 minutes. When the perp sells off relative to the oracle, SPX tends to follow downward. Statistically significant at p<0.001.
The signal is directionally correct in 5 of 6 sessions, with March 19 (+7.51 bps gap) and March 25 (+3.37 bps gap) contributing most of the effect. March 24 was the one inverted session (-0.54 bps).
A note on magnitude: the mean effects are small relative to per-bar volatility (~13 bps standard deviation). This is a noisy signal that works on average across many observations, however individual bars are highly variable.
Signal 2: Taker Order Flow
Adverse selection
Every trade on a limit order book has two sides. The maker places a resting limit order and waits. The taker crosses the spread, paying the bid-ask spread as the cost of immediacy.
Why pay that cost? Urgency. A taker who expects SPX to move up in the next 10 minutes will buy now and pay the spread rather than post a limit order and risk missing the move. This creates adverse selection: the risk that a taker possesses superior information and is trading against a passive quote that hasn’t updated yet.
This is a concept every market maker lives with. When someone buys your ask aggressively, you have to ask whether they know something you don’t. In aggregate, if takers are informed, the net direction of their flow should predict where the underlying moves next.
The taker flow signal measures this net urgency over 5 minutes:

Where buy$ and sell$ are the dollar volumes of taker fills on each side. The output ranges from -1 (all selling) to +1 (all buying).
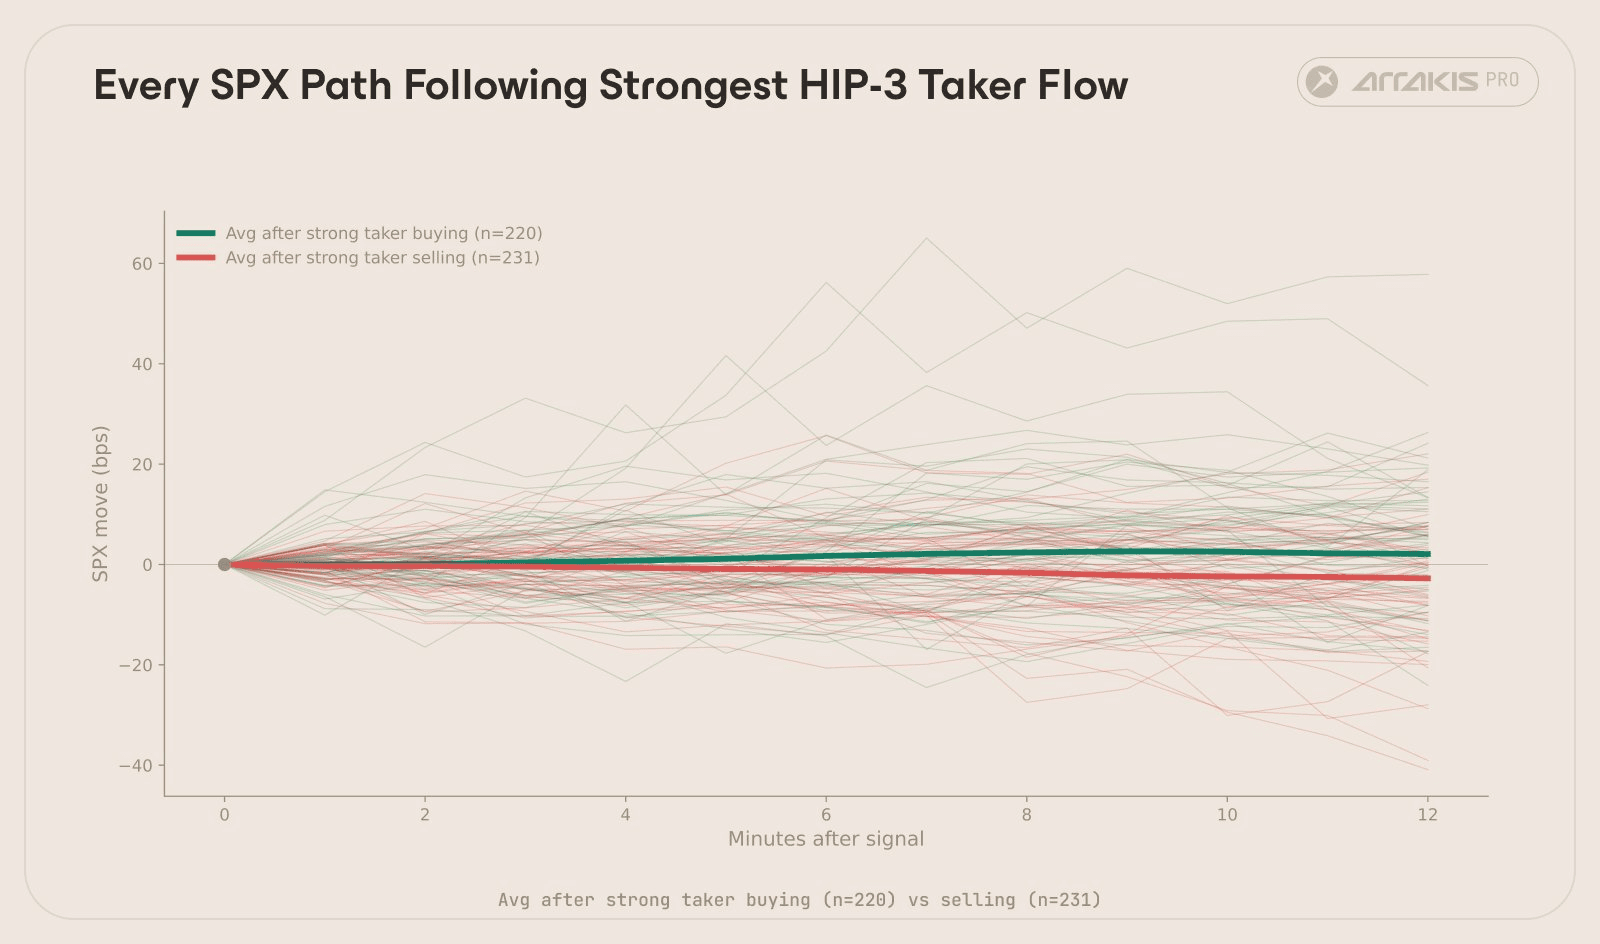
Results (all wallets)
| Metric | Q5 (net buying) | Q1 (net selling) | Gap | p-value |
|---|---|---|---|---|
| SPX 10m forward return | +2.56 bps | -2.29 bps | +4.85 bps | <0.0001 |
When takers are aggressively buying, SPX tends to rise over the next 10 minutes. When they are aggressively selling, SPX tends to fall. Comparable in magnitude to the basis signal, slightly more statistically significant.
Not all flow is equal
The aggregate signal treats every wallet the same. But some wallets consistently trade in the direction SPX is about to move. Others are consistently wrong. We can separate them.
Markout analysis. For every taker fill during cash hours, we computed how SPX moved over the next 10 minutes in the direction of the trade:

A positive markout means the trader was right: SPX moved in their direction. We averaged markouts across all fills per wallet and tested for statistical significance (p<0.05). Wallets with at least 20 fills, a statistically significant positive markout, and an average markout exceeding +1.0 bps were classified as informed. Those with a significant negative markout below -1.0 bps were classified as adversely selected.
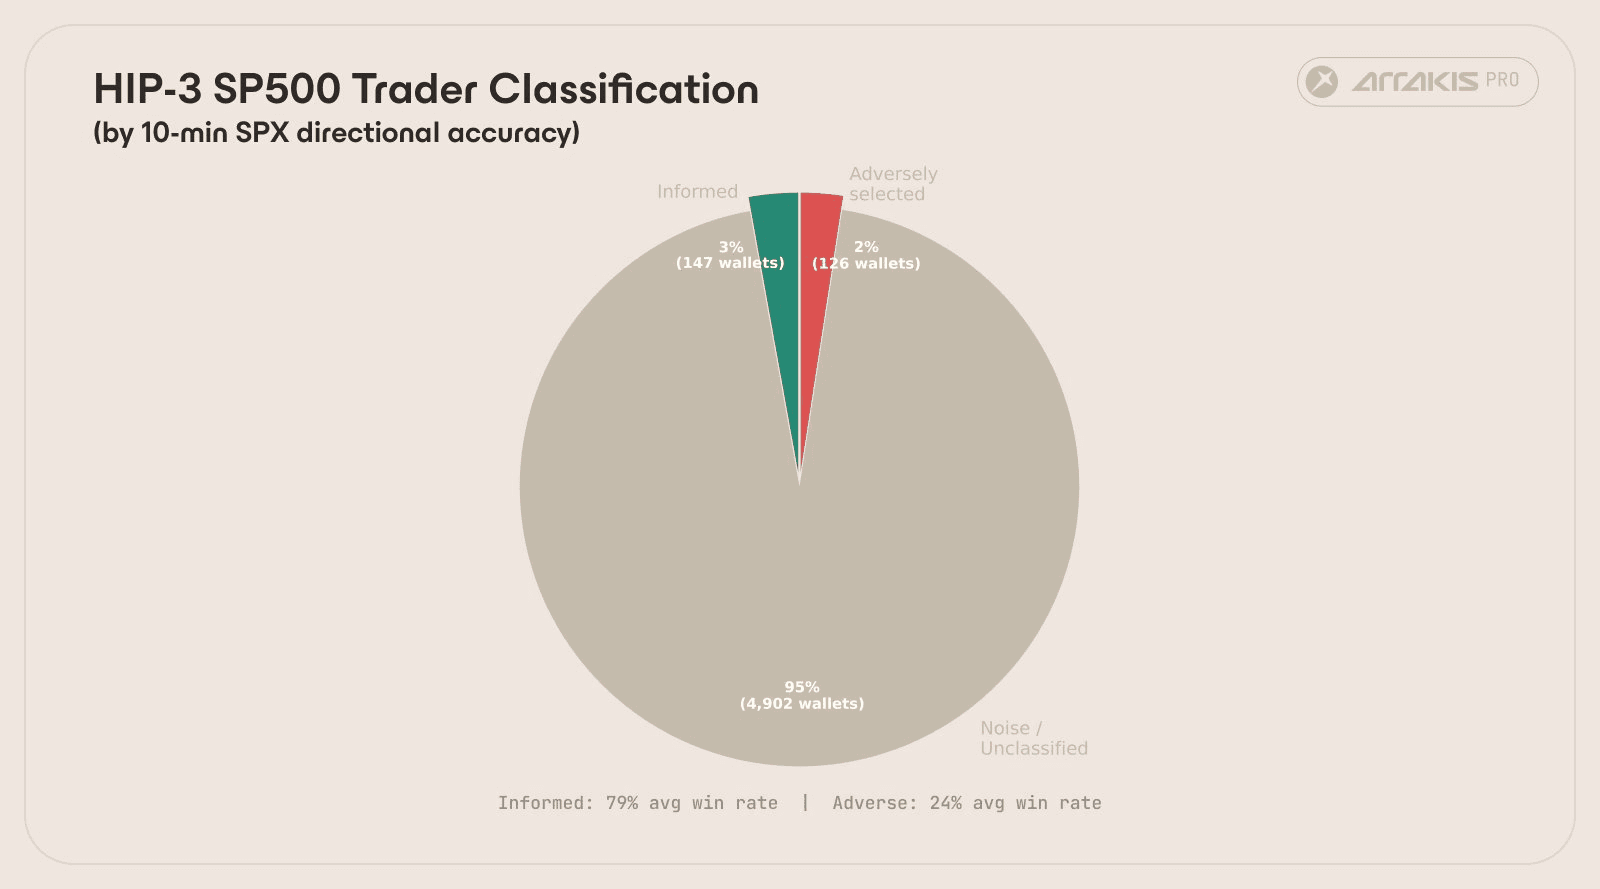
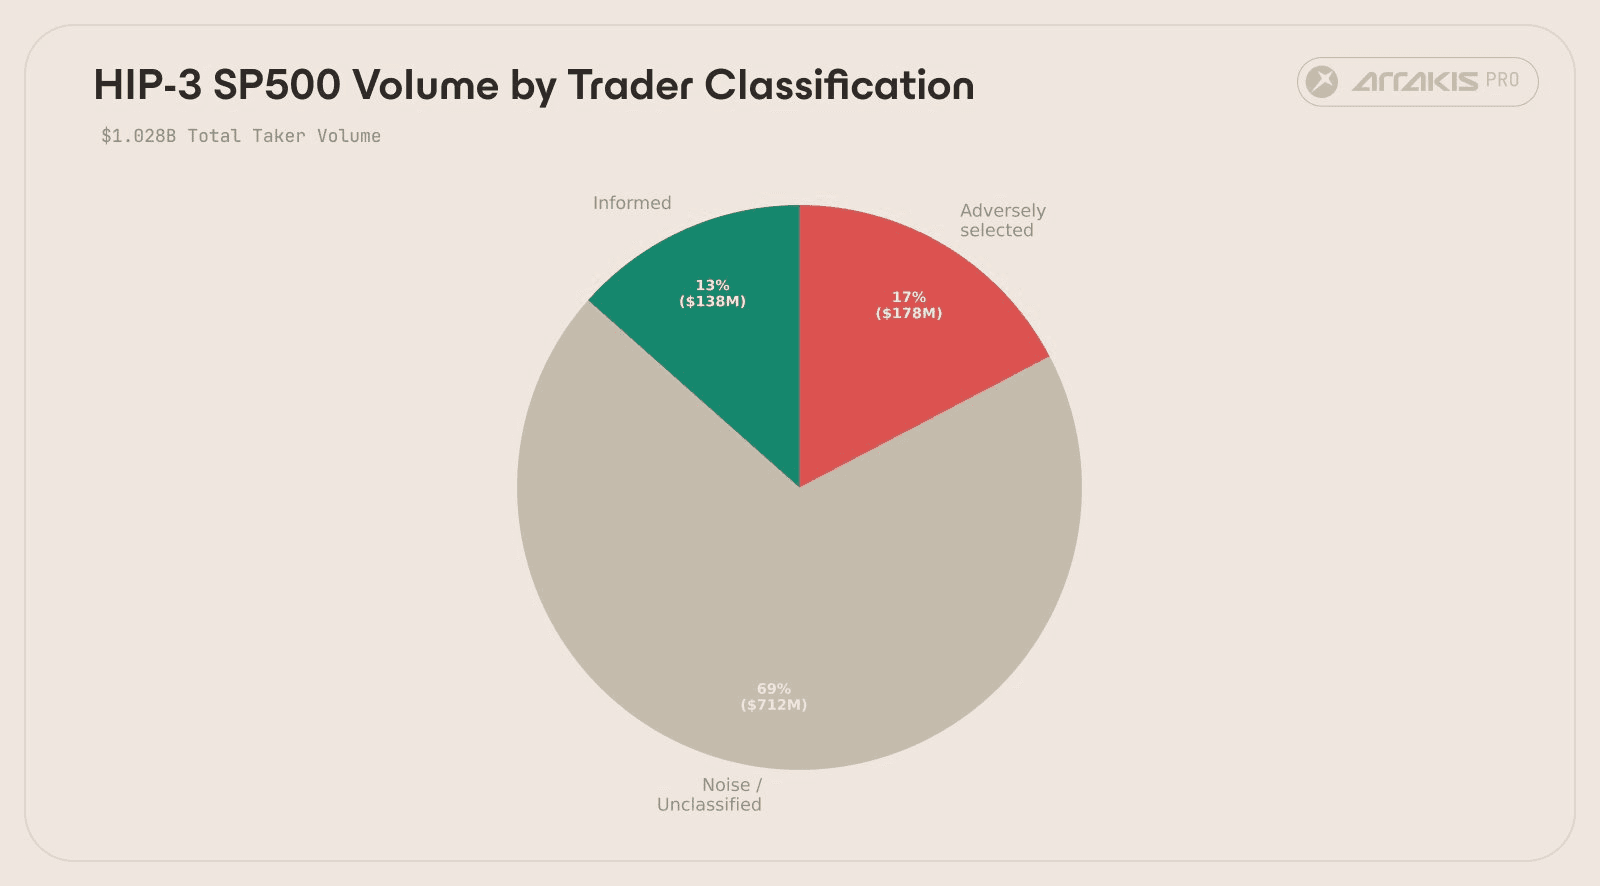
Market composition
| Classification | Wallets | Fills | Volume | % of total | Avg markout | Win rate |
|---|---|---|---|---|---|---|
| Informed | 147 (3%) | 38,558 | $138.4M | 13.5% | +7.80 bps | 79% |
| Adversely selected | 126 (2%) | 61,453 | $177.9M | 17.3% | -6.17 bps | 24% |
| Noise / unclassified | 4,902 (95%) | 294,055 | $711.7M | 69.2% | n/a | n/a |
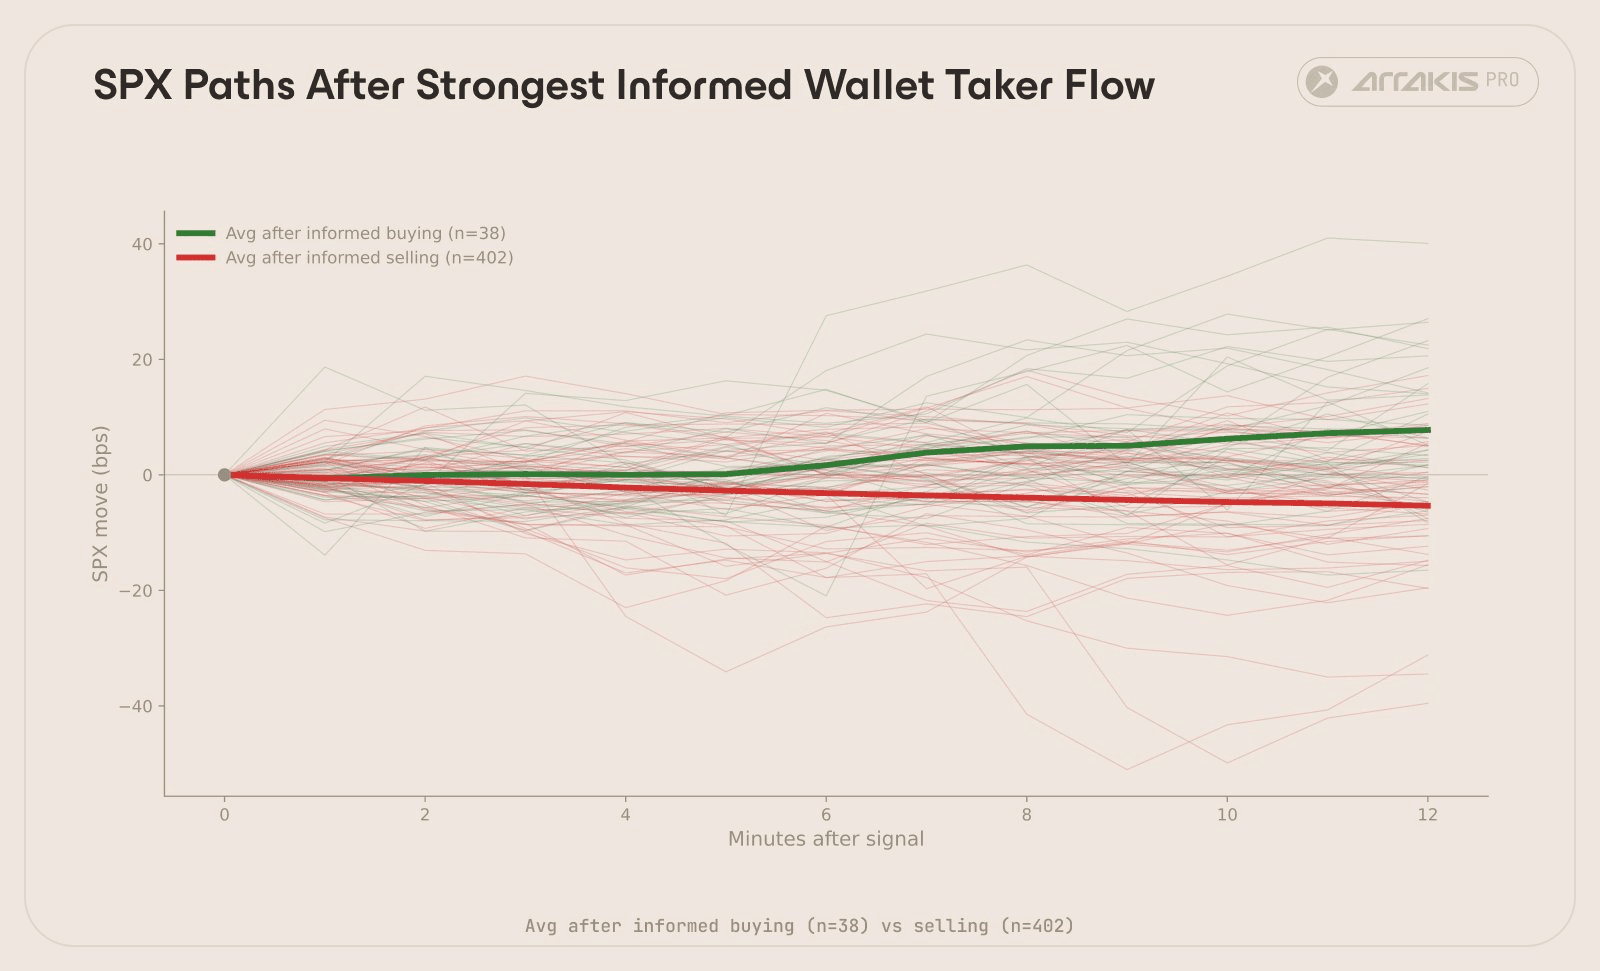
147 wallets, representing 3% of all participants, predict SPX direction with 79% accuracy at the 10-minute horizon. They represent 13.5% of total taker volume and trade disproportionately more than average.
On the other side, 126 wallets (2% of participants, 17.3% of volume) are consistently wrong. When they buy, SPX tends to go down. When they sell, it tends to go up. This is adverse selection in its purest form: these wallets are systematically on the wrong side of informed flow.
The remaining 95% show no statistically significant directional edge, with either too few fills to qualify, or no consistent correlation between their trades and subsequent SPX moves.
The informed-only signal
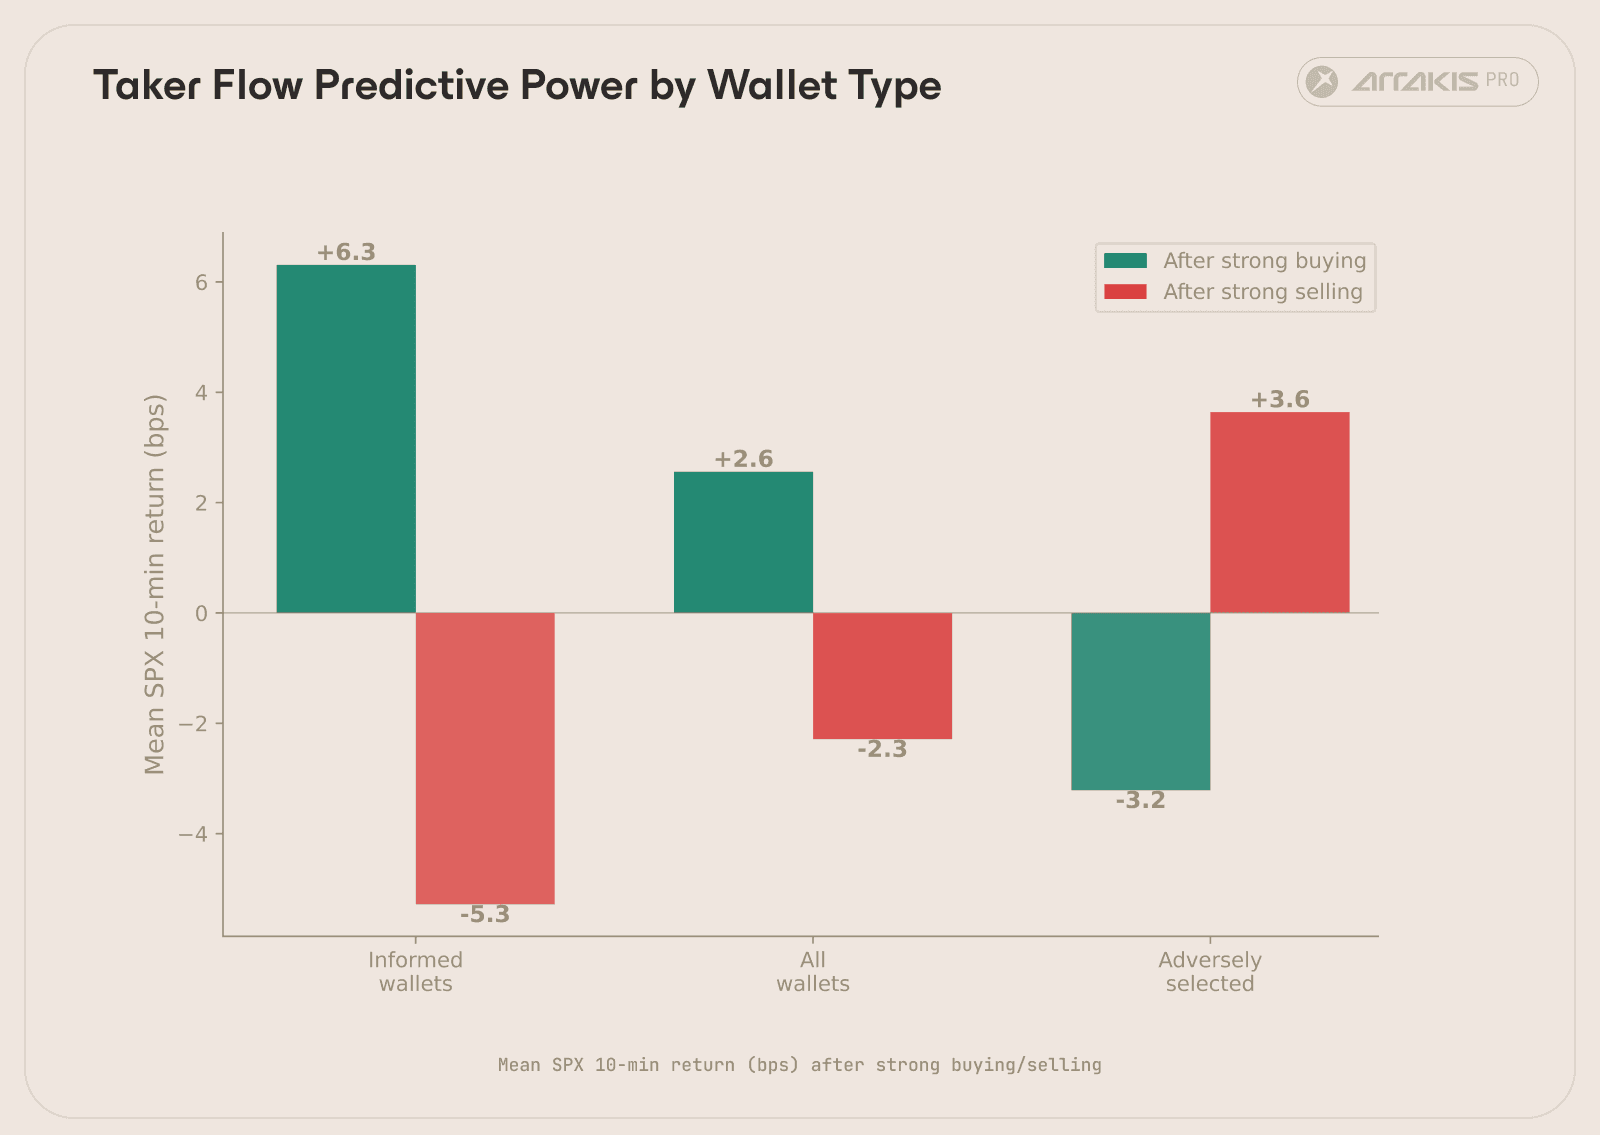
Filtering the taker flow signal to include only fills from these 147 informed wallets more than doubles the predictive power:
| Signal variant | Q5 (bullish) | Q1 (bearish) | Gap | p-value |
|---|---|---|---|---|
| Informed-only | +6.31 | -5.28 | +11.59 bps | <0.0001 |
| All wallets | +2.56 | -2.29 | +4.85 bps | <0.0001 |
| Adversely selected only | -3.21 | +3.64 | -6.85 bps (inverted) | <0.0001 |
The informed-only signal was 2.4x stronger than the all-wallets version. The noise and adversely selected flow dilutes roughly half the information in the raw aggregate.
The adversely selected wallets produce a negative predictor: when they buy, SPX goes down. Their flow was consistently on the wrong side.
Top informed wallets
| Wallet | Fills | Correct direction | Avg markout (bps) | Total volume | p-value |
|---|---|---|---|---|---|
| 0xf579…8907 | 231 | 100% | +6.48 | $4.9M | <0.0001 |
| 0x8f8b…0f5c | 629 | 59% | +2.81 | $4.3M | <0.0001 |
| 0x61c4…2264 | 410 | 88% | +4.27 | $3.8M | <0.0001 |
| 0xe9ff…5903 | 530 | 57% | +1.67 | $3.3M | 0.0026 |
| 0xae5f…5448 | 346 | 54% | +3.54 | $2.8M | <0.0001 |
| 0xebe8…885f | 287 | 93% | +11.31 | $2.2M | <0.0001 |
| 0xbfc5…b8f6 | 158 | 100% | +7.20 | $1.7M | <0.0001 |
Multiple wallets with 100+ fills and 100% directional accuracy against SPX at 10 minutes. The p-values confirm statistical significance.
The Game
We have two signals that independently predict SPX direction at 10-minute horizons: the basis spread and informed taker flow. To understand what this edge means in practice, and what it means to trade without one, consider a simple game.
You wager X on whether the S&P 500 will be higher or lower 10 minutes from now. Correct prediction: you receive 2X. Wrong: you lose your wager. No fees, no spread, no execution complexity. A pure coin flip.
The expected profit:

At odds, p = 0.50: expected profit is zero. Fair game. A random player breaks even before costs.
Composite signal
We combined the two surviving signals into a composite, weighting informed taker flow at 2x (the stronger predictor) and basis spread at 1x:

Where, z(x) is a rolling 60-minute z-score, a measure of how unusual the current reading is compared to the last hour. Z-scoring puts both signals on the same scale. Informed flow receives double weight because it is the stronger predictor.
We predict UP when the composite exceeds +0.5, DOWN when it falls below -0.5, and skip otherwise.
Results (6 sessions, Mar 18-25)
| Metric | Value |
|---|---|
| Total predictions | 210 |
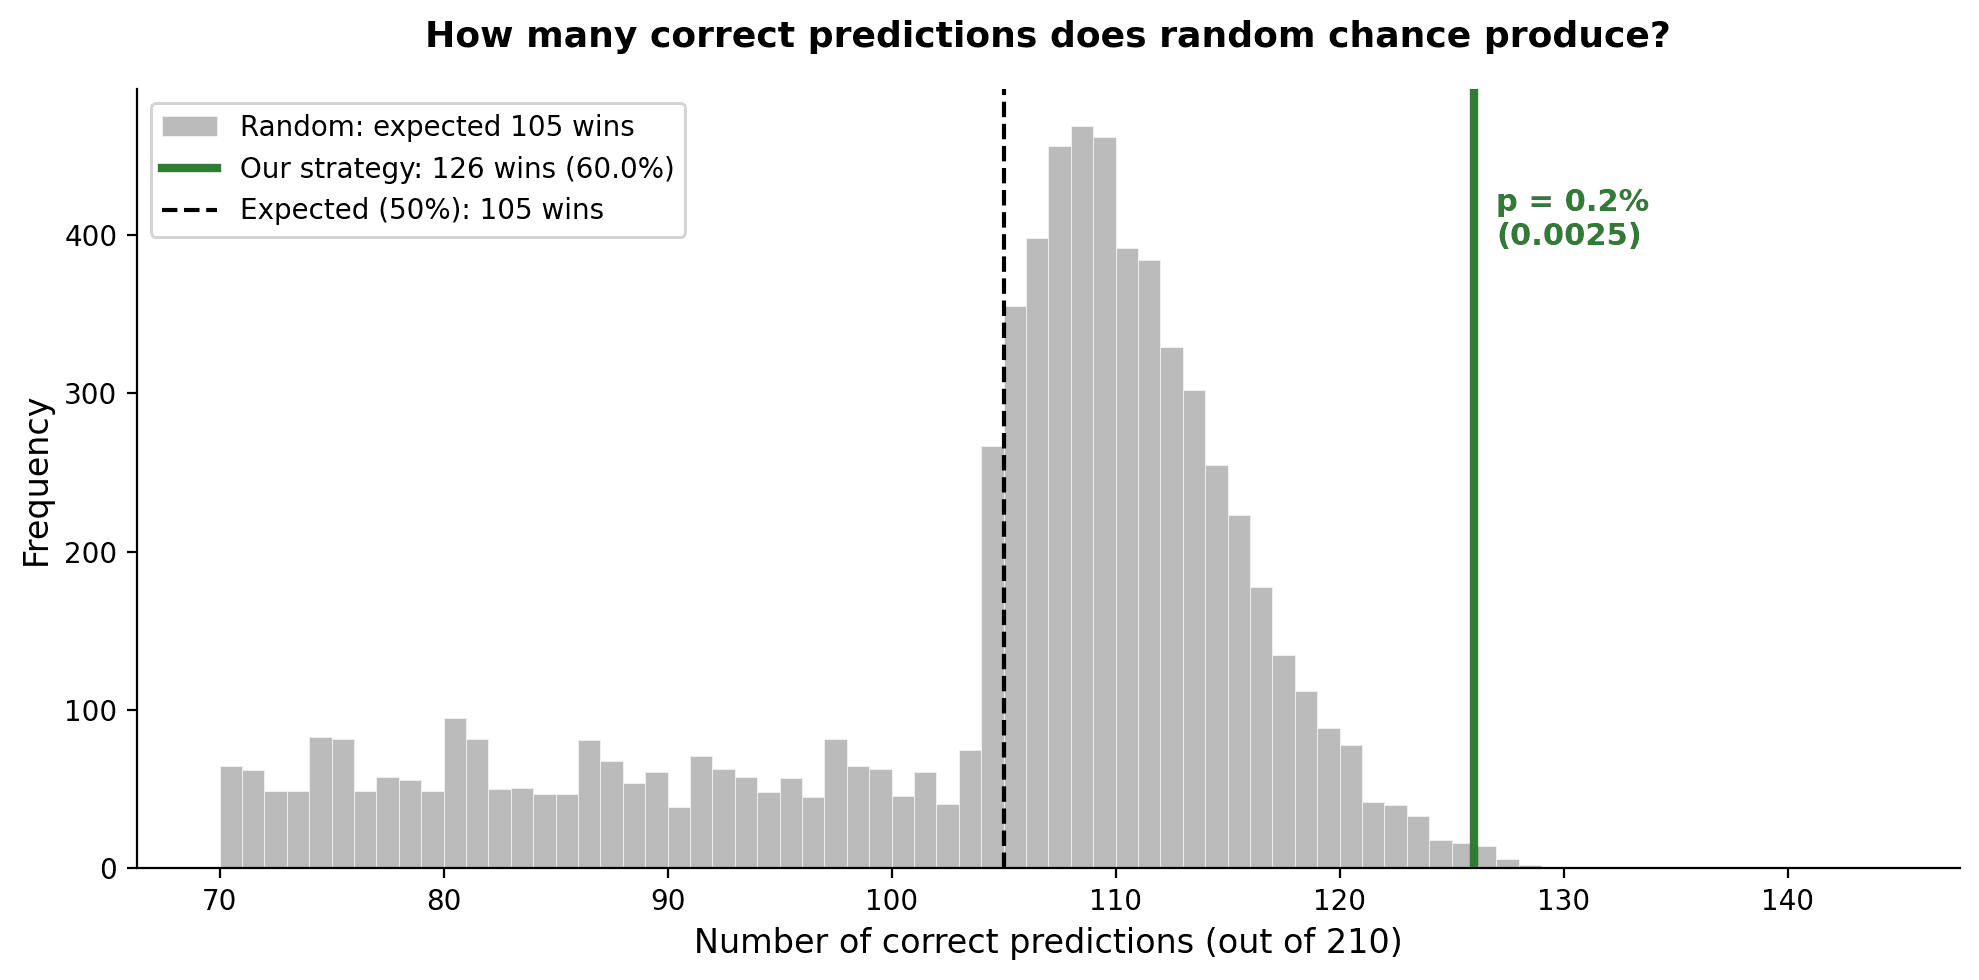
| Correct | 126 (59.5%) |
| p-value (binomial test) | 0.0035 |
| Expected profit per $1 wagered | +$0.19 |
| Profitable sessions | 6 out of 6 |
At 59.5% accuracy, every dollar wagered returns 19 cents in expected value. Even the lower bound of the 95% confidence interval (52.9%) sits above the 50% breakeven.
Informed versus uninformed
A trader without an informational edge is playing this game at $p = 0.50$. Expected profit: zero before costs, negative after spreads and fees. Over enough trades, this compounds against you.
A trader whose flow aligns with the informed signals we identified is playing at $p \approx 0.595$. The edge is small: 9.5 percentage points above a coin flip. But compounding works in their favour instead of against them. Our composite signal’s 126 correct predictions out of 210 sits in the top 0.11% of all random outcomes.
Position sizing and compounding
The Kelly criterion gives the optimal fraction of bankroll to wager per trade to maximise long-run growth:

At p = 0.595, f* is 0.19. At p = 0.50 (no edge), f* = 0, the formula says don’t bet.
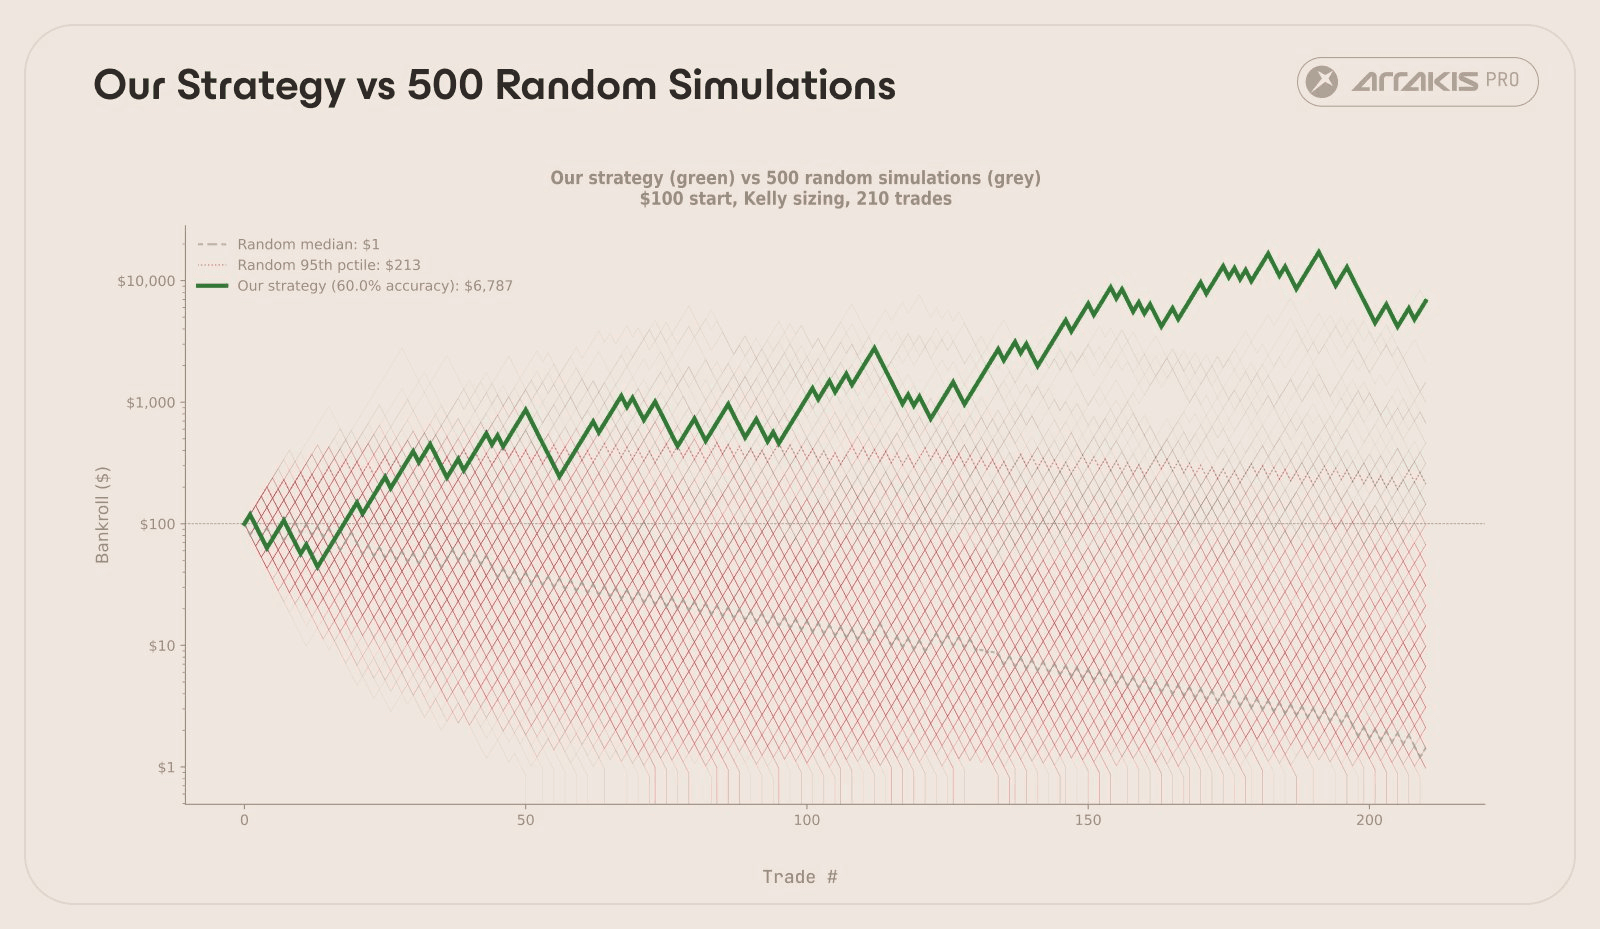
Monte Carlo simulation (10,000 runs, 210 trades):
| Strategy | Median outcome (Assuming $100 initial capital) | % profitable | Median max drawdown |
|---|---|---|---|
| Full Kelly (19%) | $4,620 | 90.5% | -86% |
| Half-Kelly (9.5%) | $1,745 | 98.3% | -56% |
| Random Player (Full Kelly) | $1.43 | 7.5% | -99.5% |
Kelly at 50% accuracy tells you to bet nothing: f* = 0. A rational player with no edge would walk away. But traders routinely take irrational short-term directional bets with no informational advantage, paying for the privilege (spreads, fees, funding) with nothing to offset it. In the simulation, a player with no edge who sizes as if they do ends up with $1.43 from a $100 starting bankroll across 210 trades, a 98.6% drawdown.
Short-term directional trading is negative-sum for a random participant, especially when costs are included. Compounding works against you just as reliably as it works for someone who has one.
Conclusion
A week-old onchain derivative market appears to contain measurable predictive information about the world's most liquid equity index. Two independent signals predicted SPX direction at 10-minute horizons with statistical significance. A small cohort of wallets are able to do so with 79% accuracy. Hyperliquid, already the dominant onchain perps venue, may be establishing itself as a price discovery layer that extends beyond crypto.
This conclusion rests on a small sample set of six sessions of data and the market is too new to draw durable conclusions. Whether this lead-lag relationship holds as liquidity deepens and more participants arrive is a question only time will tell.
Credit: Arrakis Finance, originally published March 27, 2026. Original source.