
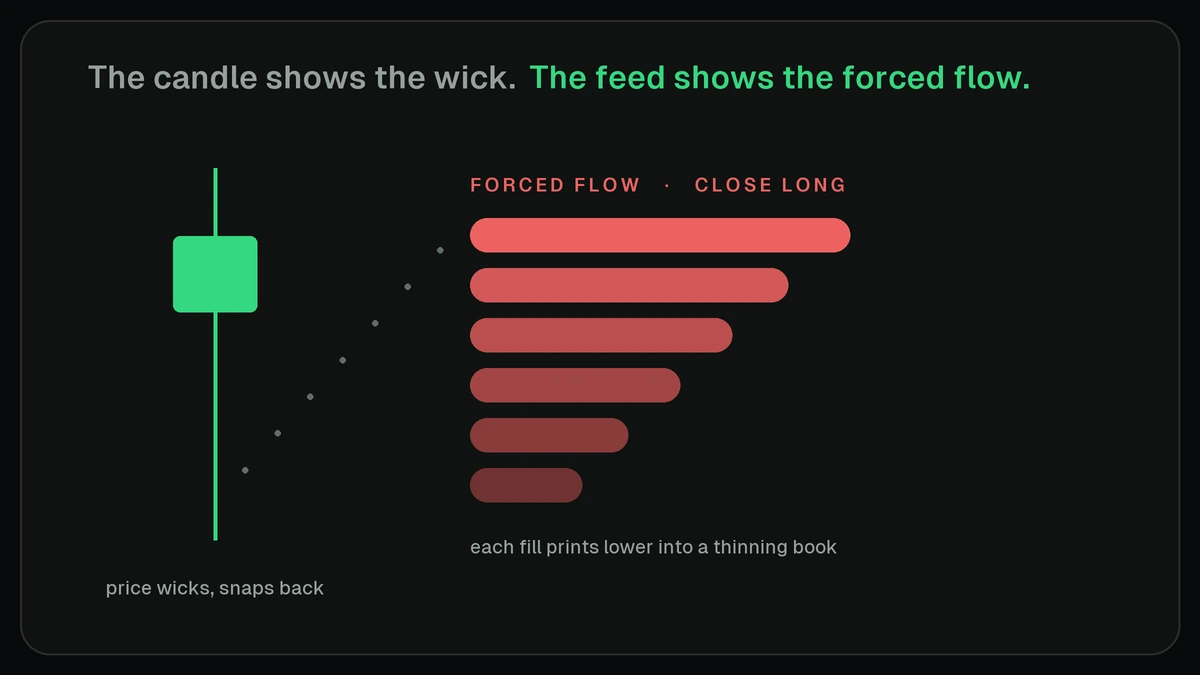
A candle tells you where price closed. It does not tell you why it got there. When Bitcoin wicks 4% in ninety seconds and snaps back, the OHLCV bar shows a long lower shadow and nothing else. The liquidation feed shows the truth: a cluster of forced longs hitting the book, each fill pushing price into the next stop, until the selling ran out of fuel. Liquidation data is the record of who got forced out, at what price, and in which direction. 0xArchive carries that record for Hyperliquid as discrete on-chain events over REST and WebSocket, going back to December 2025, across 150+ symbols, with the order book, funding, and open interest sitting next to it so you can reconstruct the whole move. The one-sentence takeaway: the candle shows the outcome, the liquidation feed shows the mechanism.
How a liquidation cascade works
A liquidation is a forced exit. A trader's account equity falls below maintenance margin, and the position gets closed at market whether they like it or not. On Hyperliquid the trigger is the mark price, which blends external CEX prices with Hyperliquid's own book state, so a single thin venue cannot wick someone out on its own.
One liquidation is noise. A cascade is the chain reaction. Here is the loop:
- Price drops to a level where a batch of leveraged longs sits below maintenance margin.
- Those positions get closed as market sells. That is real size hitting the bid.
- The forced selling pushes price lower into the next batch of stops.
- That batch liquidates. The selling feeds itself. Repeat until the cluster is drained or the book absorbs it.
The violence of a cascade depends on one thing the candle never shows you: how thin the book was at the trigger price. The same $50M of forced longs is a shrug into deep liquidity and a 6% air pocket into a thin one. That is why liquidation data only makes sense next to order-book depth. Forced selling into a thinning book is the entire story of a stop run.
Hyperliquid adds structure worth knowing. Positions over $100,000 are not dumped all at once. Only 20% is sent as the first market liquidation order, then a 30-second cooldown runs before the next chunk. If the book is too thin to absorb the position and equity falls below two-thirds of maintenance margin, a backstop takes over: the position transfers to the liquidator vault, a component of HLP. The PnL from backstop liquidations flows to the community through HLP rather than to a privileged desk. For a data reader this matters because it shapes the shape of the feed. You see staged chunks 30 seconds apart on large positions, and you see backstop takeovers as distinct fills with the vault as the counterparty.
What 0xArchive's liquidation data carries
Hyperliquid settles on-chain, so every liquidation is a real event with addresses attached, not an aggregated number from a black-box exchange feed. 0xArchive records each one. A single liquidation event looks like this:
{
  "coin": "BTC",
  "timestamp": "2026-06-20T00:33:00.842Z",
  "liquidated_user": "0x5fa3d83c06fe537648ddd7f3e696173e5f04a6bd",
  "liquidator_user": "0x093f2e026bf3d52f5ba02306976255782ffbf712",
  "price": "63630",
  "size": "0.00144",
  "side": "A",
  "mark_price": "63627",
  "direction": "Close Long",
  "closed_pnl": "0.1008",
  "trade_id": 157524276202878,
  "tx_hash": "0xba6a506e..."
}
The fields do real work:
- direction tells you whether a long or a short got forced out (
Close Long,Open Short, and so on). This is the single most useful field. Long liquidations cluster below price; short liquidations cluster above. - size and price let you build forced-flow volume by price level. That is how you reconstruct a liquidation cluster from raw events instead of trusting someone's heatmap.
- mark_price next to the fill price shows you slippage. A wide gap means the position cleared through a thin book.
- liquidated_user and liquidator_user are on-chain addresses. You can group cascades by wallet, find the backstop vault as counterparty, and study repeat liquidatees.
- closed_pnl quantifies the damage on close events.
Coverage and routes:
| Data | Route | History from | Access |
|---|---|---|---|
| Liquidation events | /v1/hyperliquid/liquidations/{symbol} | December 2025 | REST + WebSocket |
| L2 order book history | /v1/hyperliquid/orderbook/{symbol}/history | April 2023 | REST + WebSocket |
| Trades | /v1/hyperliquid/trades/{symbol} | April 2023 | REST + WebSocket |
| Funding | /v1/hyperliquid/funding/{symbol} | May 2023 | REST + WebSocket |
| Open interest | /v1/hyperliquid/openinterest/{symbol} | May 2023 | REST + WebSocket |
Liquidations on Hyperliquid are recent data. The events feed starts in December 2025, and it covers 150+ symbols. The context you pair it with reaches back much further: native L2 book and trades from April 2023, funding and open interest from May 2023. So you can study how a 2026 cascade behaved against years of funding and OI regime history. Real-time liquidations arrive on the WebSocket liquidations channel. Each event is a fill row with is_liquidation: true, the same shape as the trades channel, so one parser handles both.
Reading the move: pair liquidations with the book, funding, and OI
Liquidation data alone is a sentiment gauge, not a signal. It tells you leverage got cleared. It does not tell you what happens next. The read comes from the sequence around the event. Four signals, in order:
1. Open interest: is leverage building or unwinding?
OI rising while price grinds sideways means leverage is stacking with limited headroom. That is fuel. OI falling during a price wick means positions are getting cleared out, which can drain near-term cascade risk. The pairing of price direction and OI direction is the base layer:
- Price up + OI up: new longs driving the move. Real, but it builds liquidation fuel above.
- Price down + OI up: new shorts pressing. Squeeze risk if price reverses.
- Price down + OI down: long capitulation. The deleveraging itself.
2. Funding: which side is crowded?
Funding is the lean. Persistently high positive funding means longs are paying to stay long, which is a crowded, squeeze-prone book. Funding flipping hard negative into support often marks panic shorts and a capitulation low. When funding diverges from price, the quiet side is absorbing.
3. Liquidation type: who actually got forced out?
Now read the direction field. A wall of long liquidations confirms the down move was forced selling, not fresh conviction. A wall of short liquidations confirms a squeeze. Size and timing tell you whether it was one cluster draining or a slow bleed.
4. Book depth: was there anything to catch it?
Finally, the order book at the trigger price. Thin book plus a forced-flow spike equals an air pocket and a likely overshoot. Deep book plus the same flow equals absorption. The gap between liquidation fill price and mark_price is your slippage tell.
A short worked example
Say BTC is drifting near a level. You pull OI and see it climbing for two days while price stalls. Funding has been firmly positive. Leverage is long and crowded. Price ticks down into the level and the liquidation feed lights up with Close Long events, sizes growing, fill prices printing several ticks under mark. You pull the L2 book history for that minute and the bids were thin. That is a long cascade into an air pocket, not a trend change. The tell that it is exhausting rather than continuing: OI collapses on the wick and funding resets toward neutral, which means the crowded longs are gone. The candle showed you a long lower wick. The four-signal sequence showed you why it printed and why it snapped back.
How to pull it
All routes take an X-API-Key header. Liquidation history is bounded by start and end in Unix milliseconds. Keep windows tight, page with the cursor, and remember a quiet window can return a valid empty page. That is correct behavior, not an error.
# Bounded liquidation pull for BTC over one day
curl -s "https://api.0xarchive.io/v1/hyperliquid/liquidations/BTC?start=1781913600000&end=1782000000000&limit=1000" \
  -H "X-API-Key: $OXARCHIVE_API_KEY"
A small Python loop that pages a window, splits liquidations by direction, and pulls book depth for context:
import requests

BASE = "https://api.0xarchive.io/v1/hyperliquid"
HEADERS = {"X-API-Key": "YOUR_KEY"}

def liquidations(symbol, start_ms, end_ms):
    rows, cursor = [], None
    while True:
        params = {"start": start_ms, "end": end_ms, "limit": 1000}
        if cursor:
            params["cursor"] = cursor
        r = requests.get(f"{BASE}/liquidations/{symbol}",
                         headers=HEADERS, params=params, timeout=30)
        r.raise_for_status()
        body = r.json()
        rows.extend(body.get("data", []))
        cursor = body.get("meta", {}).get("next_cursor")
        if not cursor:               # empty or final page
            return rows

events = liquidations("BTC", 1781913600000, 1782000000000)

longs  = [e for e in events if "Long"  in e["direction"]]
shorts = [e for e in events if "Short" in e["direction"]]

long_notional  = sum(float(e["size"]) * float(e["price"]) for e in longs)
short_notional = sum(float(e["size"]) * float(e["price"]) for e in shorts)

print(f"events={len(events)} "
      f"long_liq=${long_notional:,.0f} short_liq=${short_notional:,.0f}")

# Then pair with the book around the cascade minute:
book = requests.get(f"{BASE}/orderbook/BTC/history",
                    headers=HEADERS,
                    params={"start": 1781915520000, "end": 1781915640000},
                    timeout=30).json()
From there you bucket liquidation notional by price to build clusters, line up funding and OI for the same window with /funding/BTC and /openinterest/BTC, and you have the full microstructure of the move in one pass.
Liquidation data vs liquidation dashboards
Most liquidation tools are dashboards: a heatmap or a running total, aggregated and visual. Useful for a glance, hard to backtest. 0xArchive serves the raw events instead: every liquidation as a discrete on-chain record with addresses, direction, size, and slippage to mark, bounded by time and paired on the same API with the order book, funding, and open interest. You read the cascade event by event, then reconstruct it against the book that absorbed it.
FAQ
What does liquidation data show that price charts do not?
Direction and force. A candle shows net price movement. The liquidation feed shows whether that move was forced longs or forced shorts, how much size was cleared, and how far each fill slipped from mark. It separates a real trend from a stop run.
How far back does Hyperliquid liquidation data go on 0xArchive?
Discrete liquidation events go back to December 2025, over REST and WebSocket, across 150+ symbols. The context data reaches further: L2 book and trades from April 2023, funding and open interest from May 2023. So recent cascades can be studied against years of leverage history.
Why is the liquidations endpoint returning empty pages?
Because nothing got liquidated in that window. The route is bounded by start and end, and a quiet period returns a valid empty page. Page with meta.next_cursor until it is null. Empty is data, not failure.
Can I tell long liquidations from short liquidations?
Yes. The direction field on each event (for example Close Long or Open Short) tells you which side was forced out. Long liquidations cluster below price and accelerate downside; short liquidations cluster above price and feed squeezes.
How do I detect a cascade rather than a single liquidation?
Bucket liquidation notional by short time windows and by price. A cascade is a dense run of same-direction events over seconds to minutes, with fill prices walking away from mark price. Pair it with the order book to confirm the book was thinning as the events fired.
What should I combine liquidation data with?
Open interest for whether leverage is building or unwinding, funding for which side is crowded, and order-book depth for whether there was liquidity to absorb the forced flow. Liquidations confirm the mechanism; the other three tell you what is likely next.
Do I need a paid tier to read full liquidation data?
Every tier, including Free, gets all venues, full depth, and full history. Tiers gate limits like request rate, WebSocket subscriptions, and export credits, not data access. Free carries a 90-day query window. Check the current limits on the pricing page.
Next step
Start with one symbol and one volatile day. Pull the liquidation events, split them by direction, and lay the L2 book, funding, and OI over the same window. You will read the move the candle hid. The full route reference lives in the Hyperliquid liquidations data API docs and the broader Hyperliquid REST reference. When you are ready to size up windows and add WebSocket subscriptions, the limits are on the pricing page.