
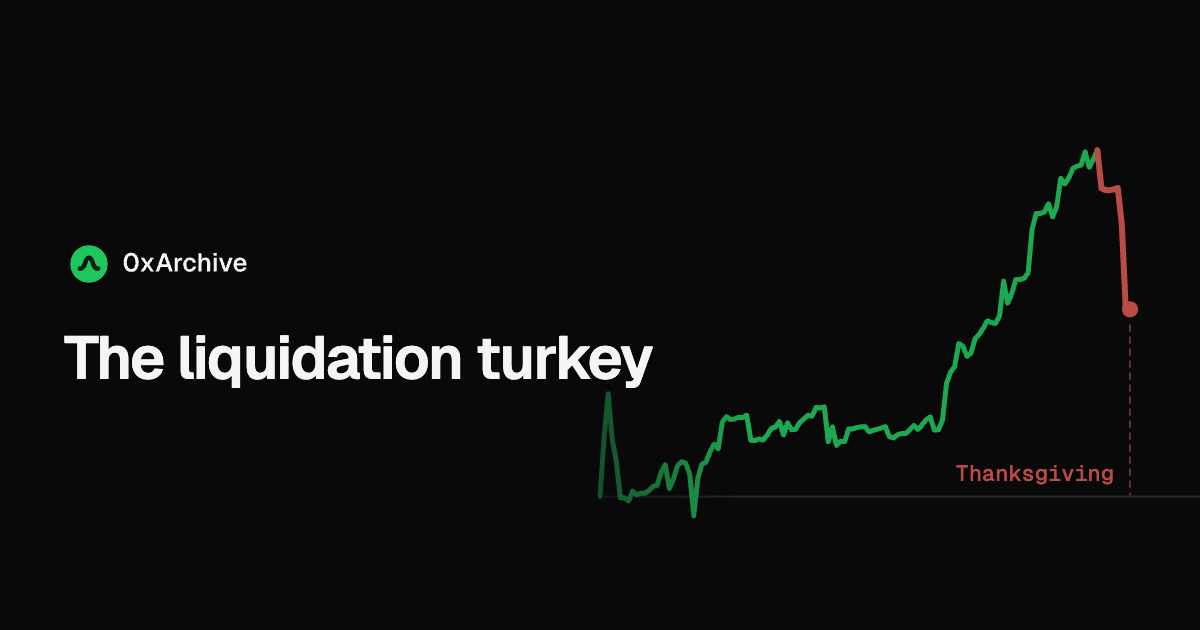
There's a turkey in Nassim Taleb's book The Black Swan. A farmer feeds it every day for 1,000 days, and every meal makes it surer the farmer is a friend. Day 1,001 is Thanksgiving.
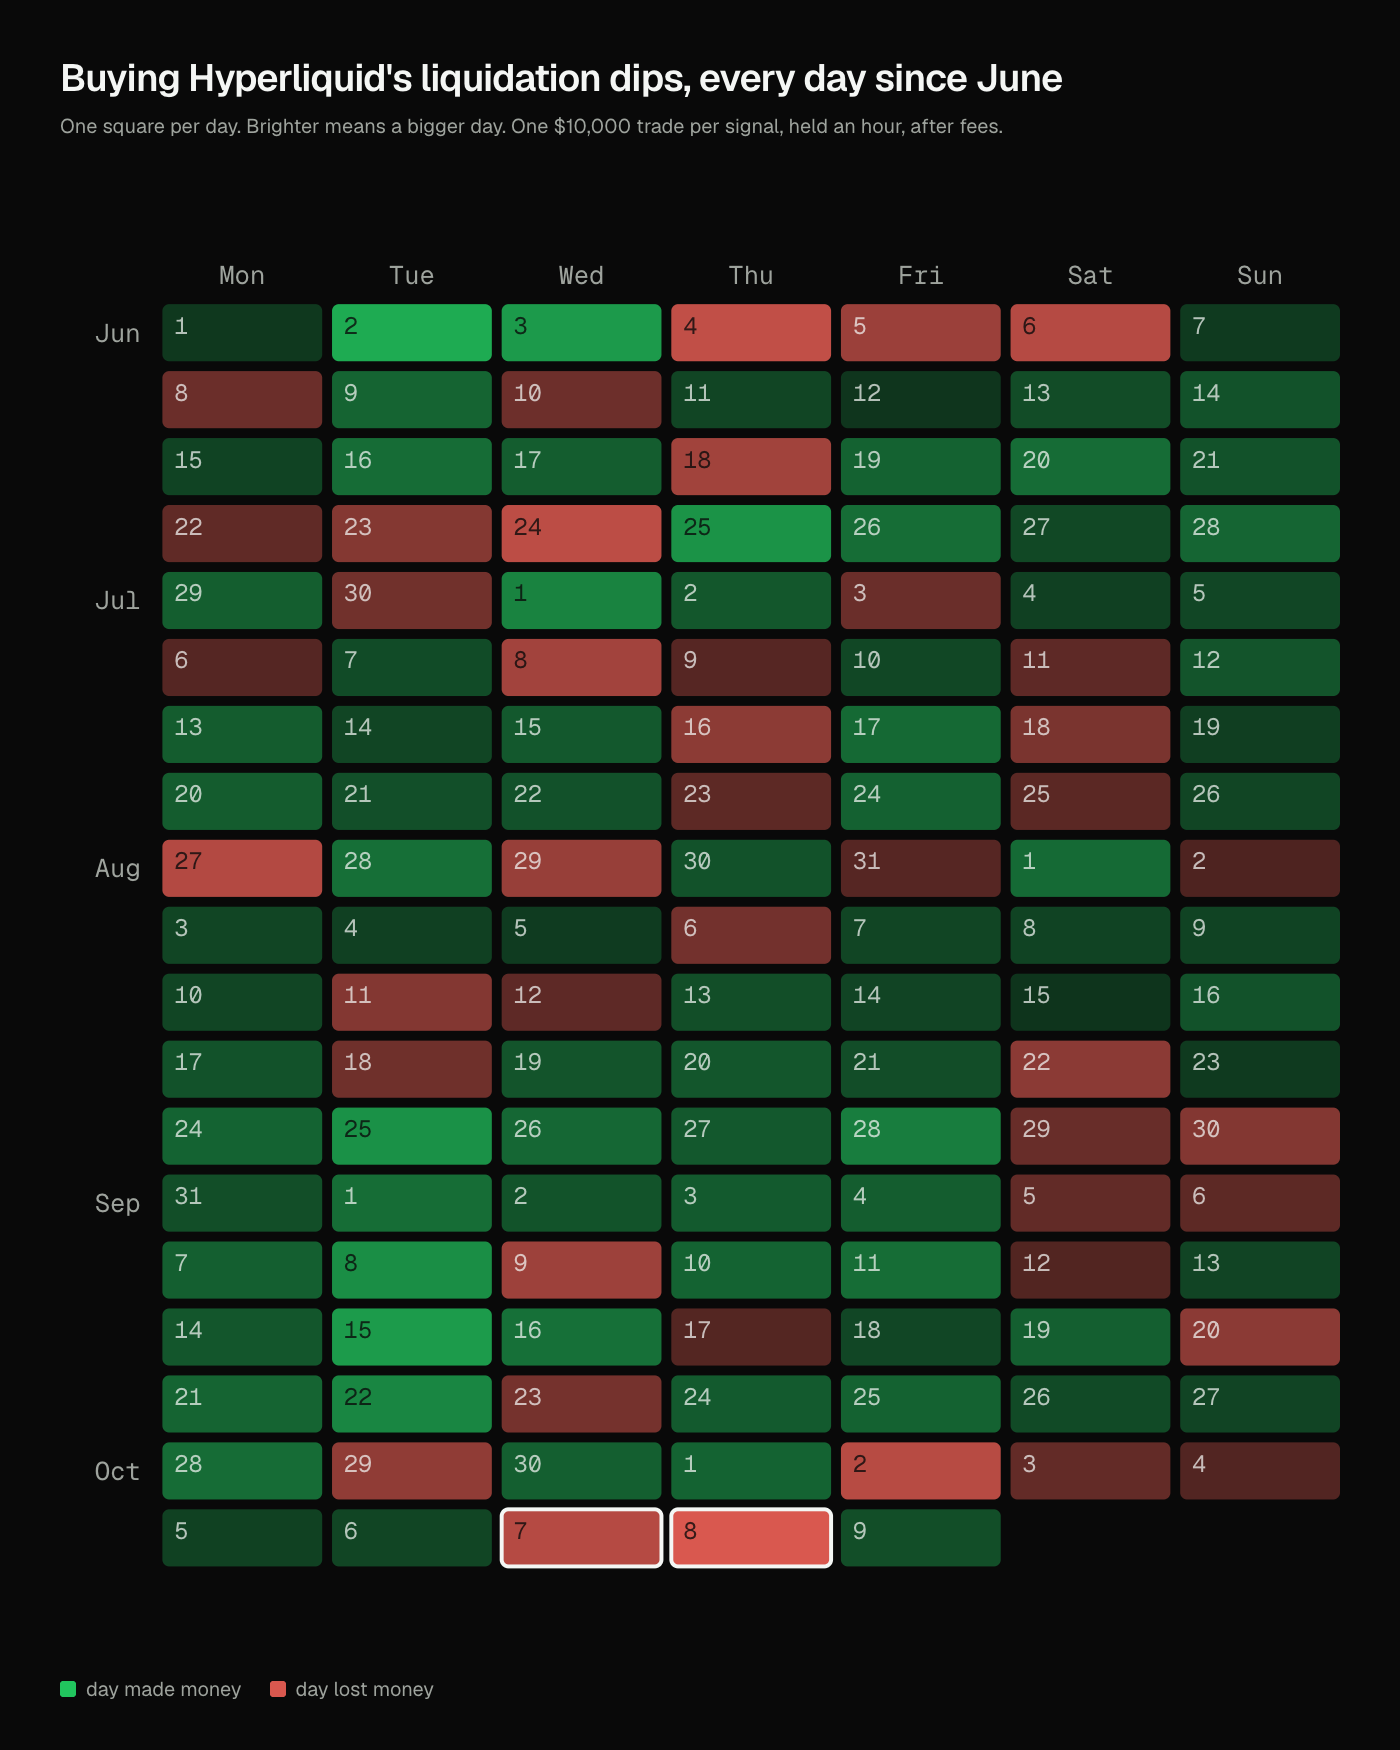
Buying the dip after a burst of forced long liquidations on Hyperliquid was that farmer this summer. It made money four months straight, and each month looked better than the last. Then came October 7 and 8.
Buying liquidation dips on Hyperliquid made money every month from June to September
The rule is simple. When a coin's long liquidations run at 10 times their usual pace inside five minutes, buy at the close of those five minutes. Sell an hour later.
The idea behind it is old. Forced sellers dump at any price, and once they're done the price should snap back. On Hyperliquid's top 50 coins by volume, from June to September, it did. 0xArchive keeps liquidation volume for every one of those coins in five-minute buckets, so the whole run replays, bad days included.
| June 1 to September 30 | Result |
|---|---|
| Trades | 4,495 |
| Trades that won | 55% |
| Average per $10,000 trade | +$9.62 |
| Days that made money | 69% |
| Total, $10,000 a trade | +$43,227 |
After fees: Hyperliquid's taker fee both ways plus half the spread, $10.45 per $10,000 on average. A coin counts only in months it ranked in the top 50 by 30-day volume, delisted coins included.
From April, the bounce beat ordinary dips by more each month
Dips bounce on their own sometimes, liquidations or not. So the fair test puts each liquidation dip next to ordinary drops of the same size, from the same month, with no forced selling behind them.
From April on, the liquidation dips pulled further ahead every month. September was held back before the study ran, as a clean test, and it passed.
| Month | Beat ordinary dips by, per $10,000 | Average trade after fees |
|---|---|---|
| Dec 2025 | +$5.73 | -$0.88 |
| Jan 2026 | -$12.47 | -$29.40 |
| Feb | -$13.62 | -$0.77 |
| Mar | +$4.59 | -$1.04 |
| Apr | -$3.51 | -$11.77 |
| May | -$2.83 | -$9.38 |
| Jun | +$2.73 | +$4.43 |
| Jul | +$8.75 | +$0.97 |
| Aug | +$14.51 | +$14.04 |
| Sep, the held-back test | +$16.47 | +$18.25 |
| Oct 1 to 9 | -$23.40 | -$45.31 |
Average over the hour after entry. Each month is compared with that month's own ordinary dips. Only August and September sit clearly above zero; every other month is within its own noise, October included.
October 7 and 8 took back more than a third in two days
On October 7 and 8, $454,165,181 of longs got force-closed on those 50 coins.
The rule fired 286 times across the two days. On the 8th, six trades in ten lost, and the average one was still under water an hour later. Two days cost $15,943 on the $10,000-a-trade count, more than a third of everything the summer made.
| Day | Trades fired | Result, $10,000 a trade |
|---|---|---|
| October 7 | 124 | -$4,755 |
| October 8 | 162 | -$11,188 |
| October 1 to 9 | 424 | -$19,212 |
Nine days is a short sample, and October's result still sits inside the noise. The summer's climb held up in its test month. October tested what happens to it in a cascade.
January's cascades left the trade down since December
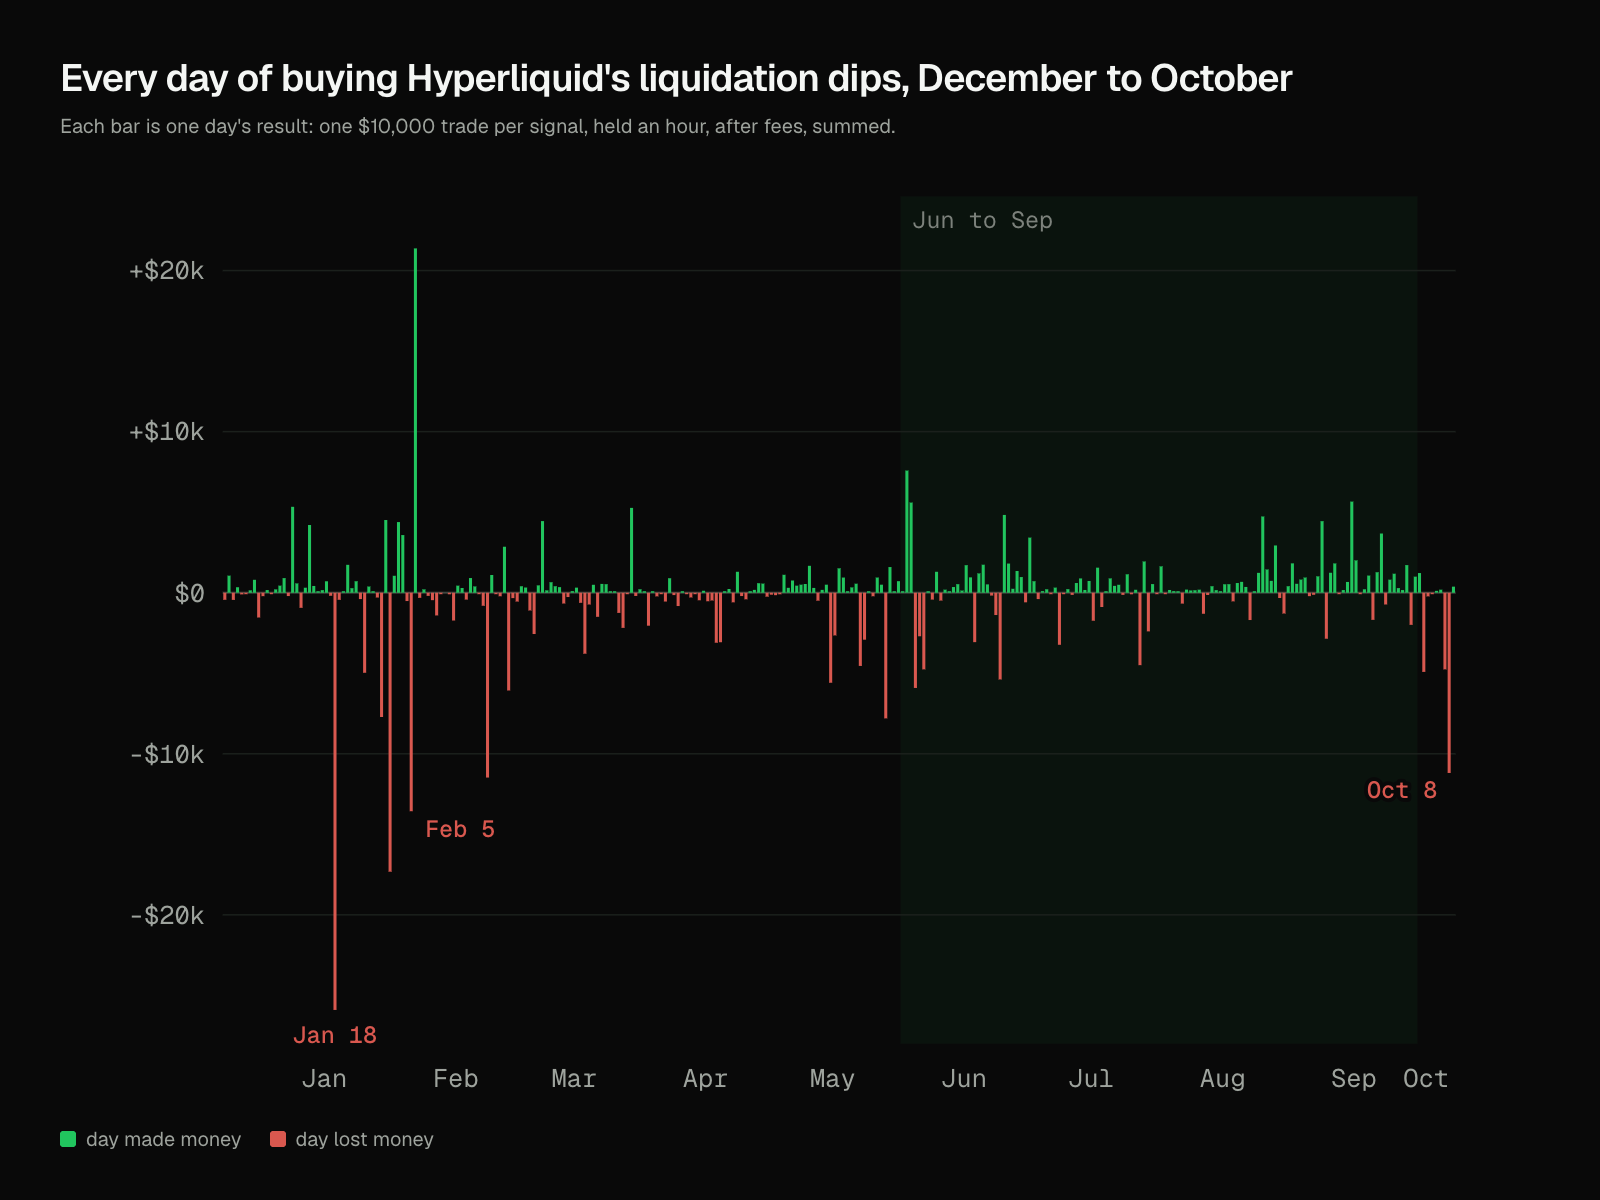
Run the same rule back to December 22, 2025, where 0xArchive's Hyperliquid liquidation history starts, and the turkey has already had one Thanksgiving.
January 18 was a Sunday-night selloff that started at 23:00 UTC, with bitcoin sliding from $95,483 to $92,613 across midnight. The rule bought 41 dips in that one hour, and the day lost $25,906.
| Worst days | Trades fired | Result, $10,000 a trade |
|---|---|---|
| January 18 | 58 | -$25,906 |
| January 31 | 188 | -$17,318 |
| February 5 | 172 | -$13,565 |
| February 23 | 80 | -$11,477 |
| October 8 | 162 | -$11,188 |
Four of the five worst days came in January and February. Between them they lost more than the whole summer made.
Quiet days pay and cascade days lose
One trade on its own is close to a coin flip, 51% win. What hurts is when the losses show up.
On a quiet day the rule fires a few times, on coins having their own bad hour, and the bounce comes through. In a cascade everything gets liquidated at once. On February 5 the rule fired 172 times on 48 of the 50 coins, and they kept falling together.
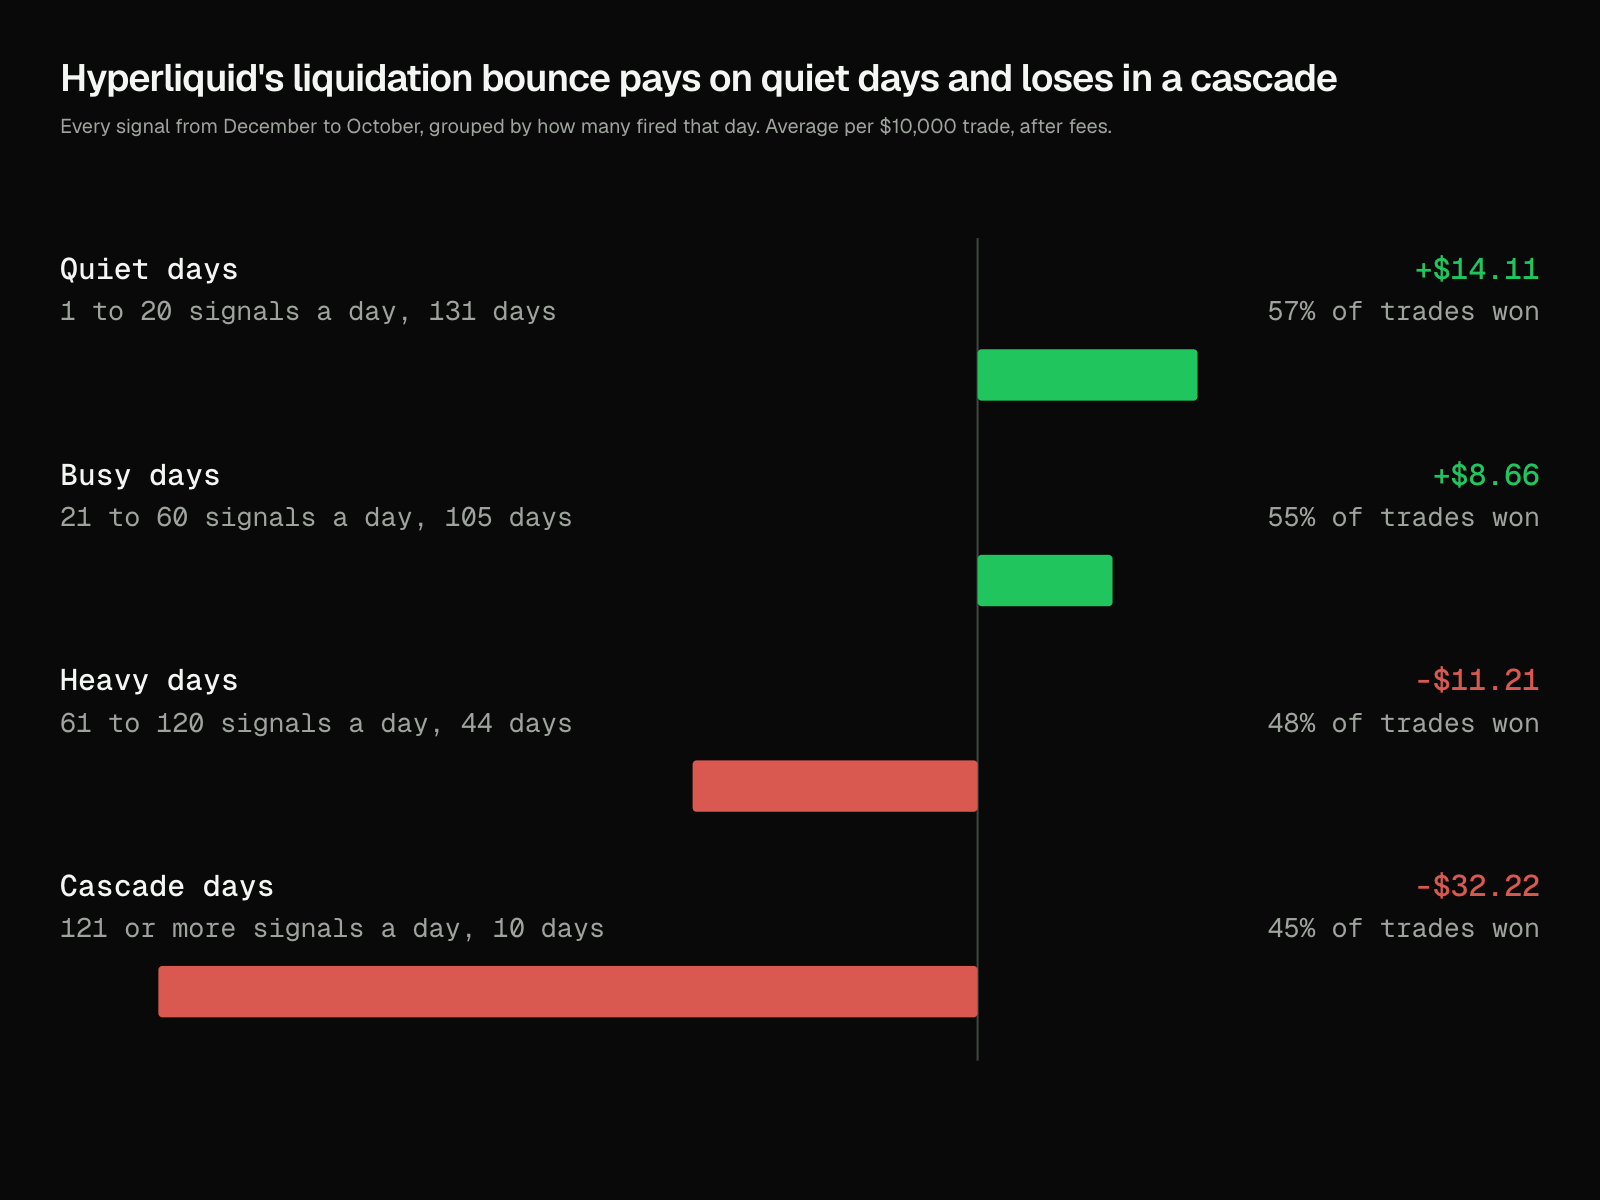
Wins arrive one at a time and losses arrive in a pile, which is the turkey's whole problem. Half of all the money lost on losing days came from the worst 10 of them.
Spotting a cascade early is the open question
You only know a day was a cascade once it's over. So a rule that skips cascade days isn't something anyone can trade yet.
Whether a cascade gives itself away early can be tested, though: how many coins start liquidating in the same few minutes, or how fast the order book refills after the first wave. Liquidation volume for every coin and the full order book behind it are both in the archive. The rule itself stays fixed, and each new month gets checked against it, starting with the rest of October.
Run this analysis from an agent
Every number here comes from the five-minute liquidation volume buckets and OHLCV candles. For single liquidations with the wallet behind each one, use the liquidation events route. Agents connect through the hosted MCP server, which uses client managed OAuth and needs no API key, or through the Claude Code skill, the agentic gateway and the other agent surfaces. For direct REST work, start with the quickstart and take a free key at signup. Webhook alerts can ping you when a large liquidation lands.
Route references
Use the liquidations reference for the volume buckets, from 1m to 1d, and the event route, the liquidation events reference for row-level records with wallets, and the candles reference for the OHLCV history the returns come from.
For current API availability and plan details, use the Hyperliquid data API, data catalog, pricing, and status.
Research output, not investment advice. Liquidation volume and candles from 0xArchive, 2025-12-22 to 2026-10-09 UTC. A signal is net long liquidations above 10x the coin's trailing seven-day average in a five-minute bucket, first in an hour. Prints that jump 3% or more and reverse 80% in the next five minutes are removed, and RESOLV is left out. Past behaviour of a market does not oblige it to repeat.