
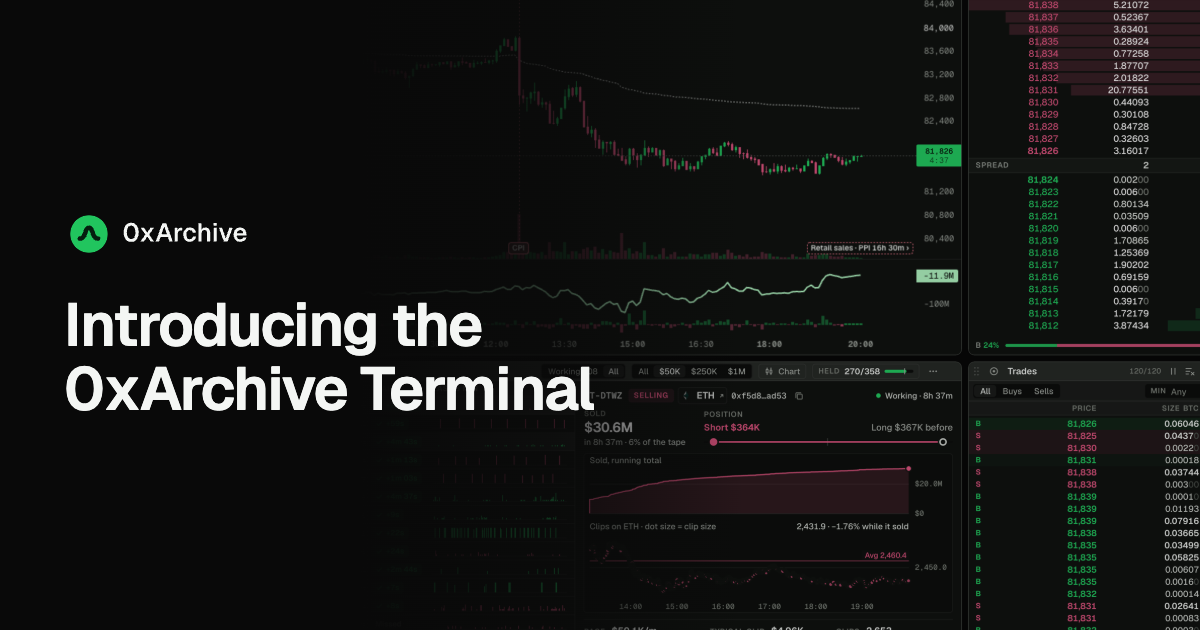
The 0xArchive Terminal is a free charting terminal for Hyperliquid and Lighter. Open terminal.0xarchive.io and it runs, with no account and no download.
On Hyperliquid it reads every account's position from 0xArchive's order-level archive, so a candle opens down to the wallet. It finds the wallet working a big order in clips, splits each bar by why it traded, and sets the crowd against the largest positions. On Lighter you get the charts, the book and paper trading.
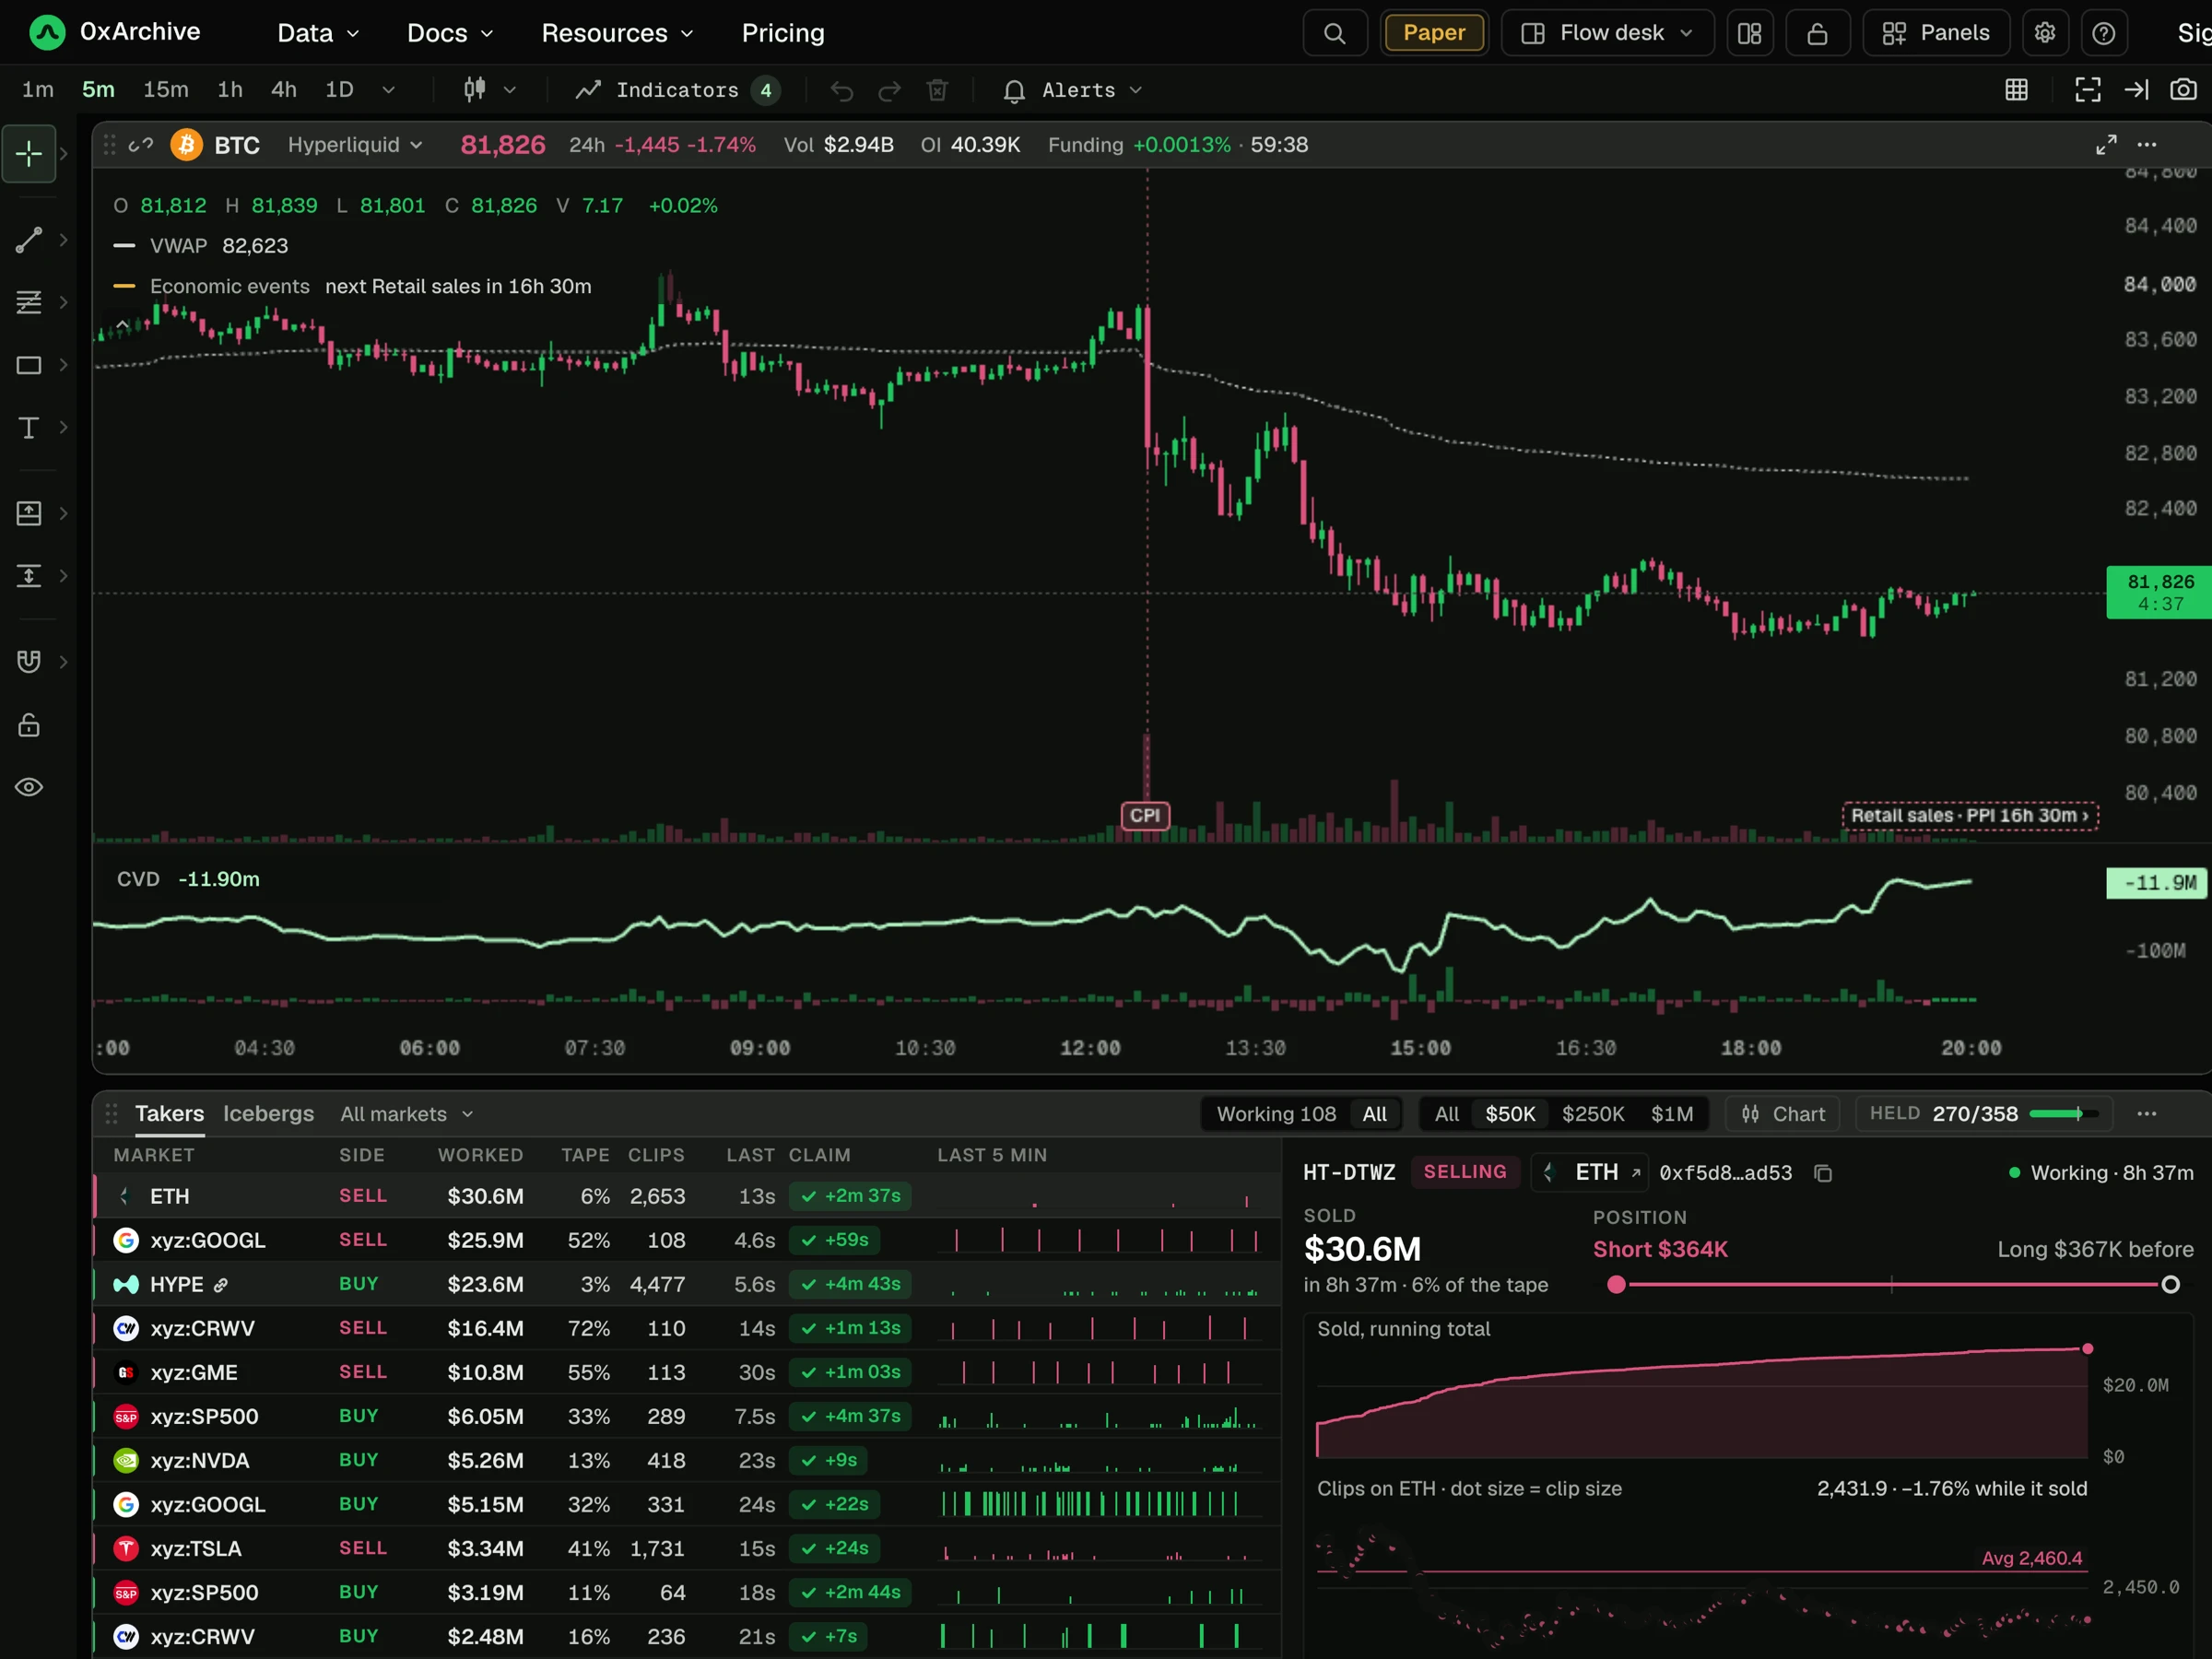
Find the wallet behind a big order with the Flow desk
Big traders cut an order into small clips so it does not stand out on the tape. The Flow desk joins the clips that belong to one wallet while they are still coming, adds them up, and puts that wallet's position beside the total. Icebergs sit in the same panel: wallets that keep refilling a small visible order at one price.
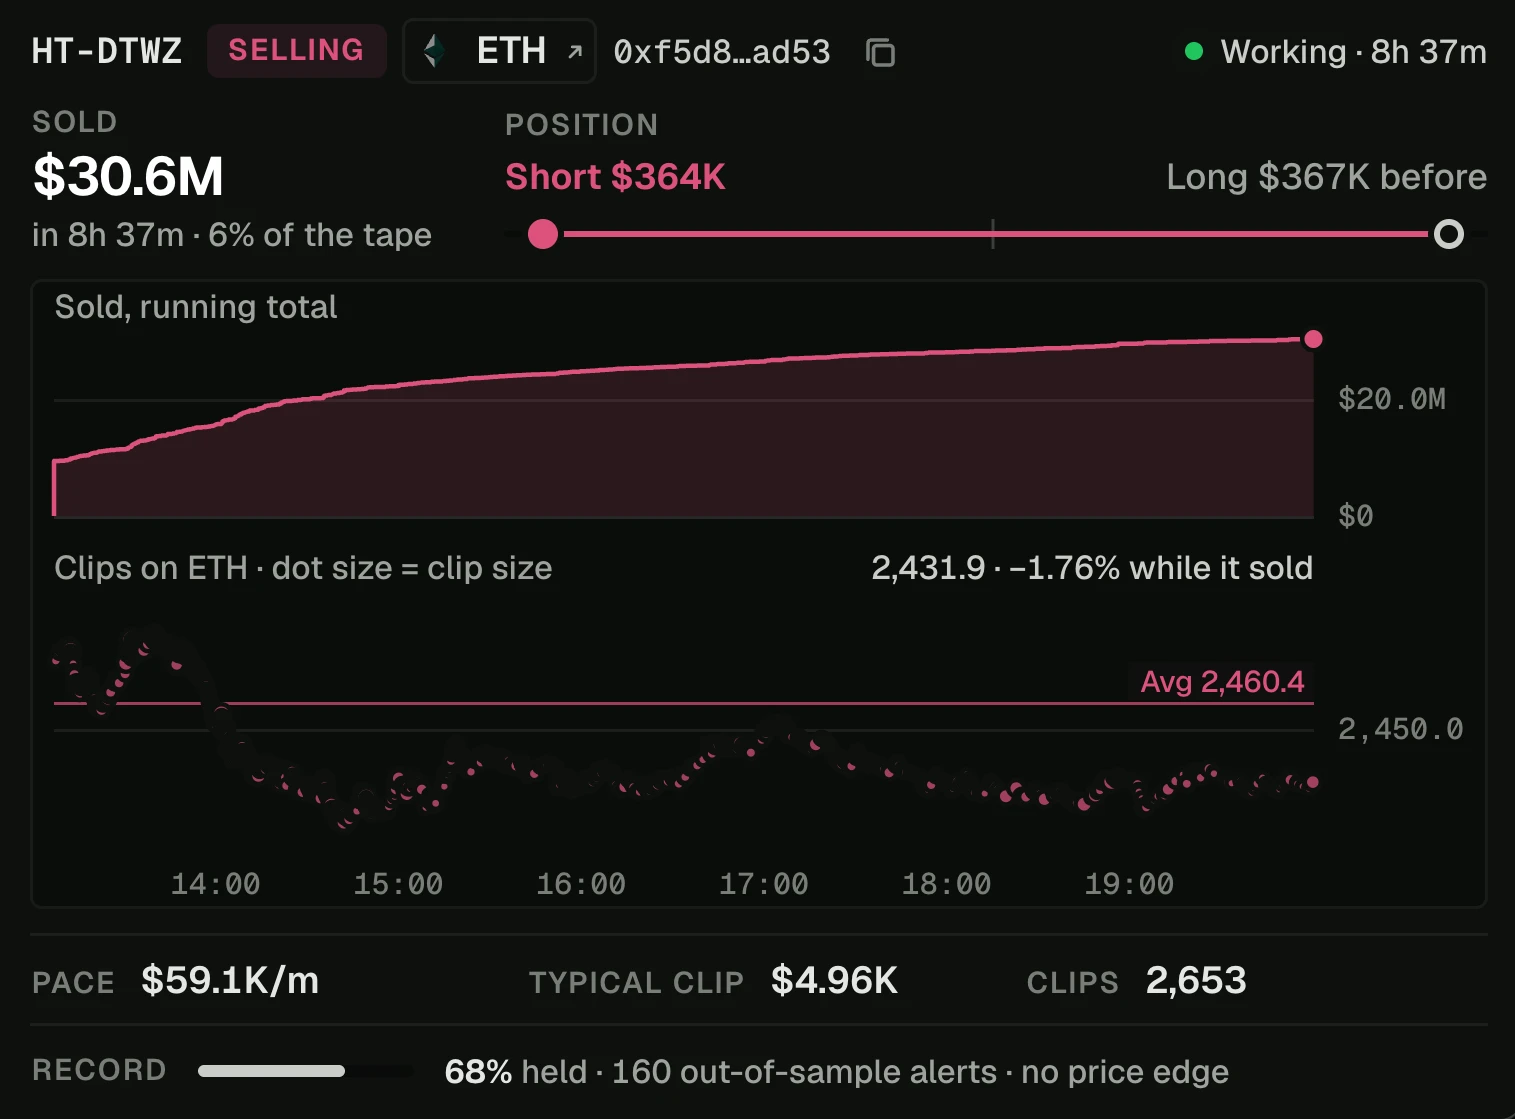
Set the total against the position. This wallet sold $30.6M, and its position went from a $367K long to a $364K short.
Every detection carries its record, and the panel prints it in one line. On 14 Oct 2026 it read "68% held · 160 out-of-sample alerts · no price edge": after 68% of those alerts the wallet took its largest clip again within five minutes, and price did not follow. The Flow desk shows who is trading. It makes no call on where price goes.
Trade intent splits each bar by why it traded
Trade intent follows every Hyperliquid account's position through each bar, so every trade gets a reason: a new long, a new short, a stop, or profit taken. Each bar is a column, buying above zero and selling below, coloured by reason. The readout gives the bar's buying, its selling, and how much of the buying was shorts closing.
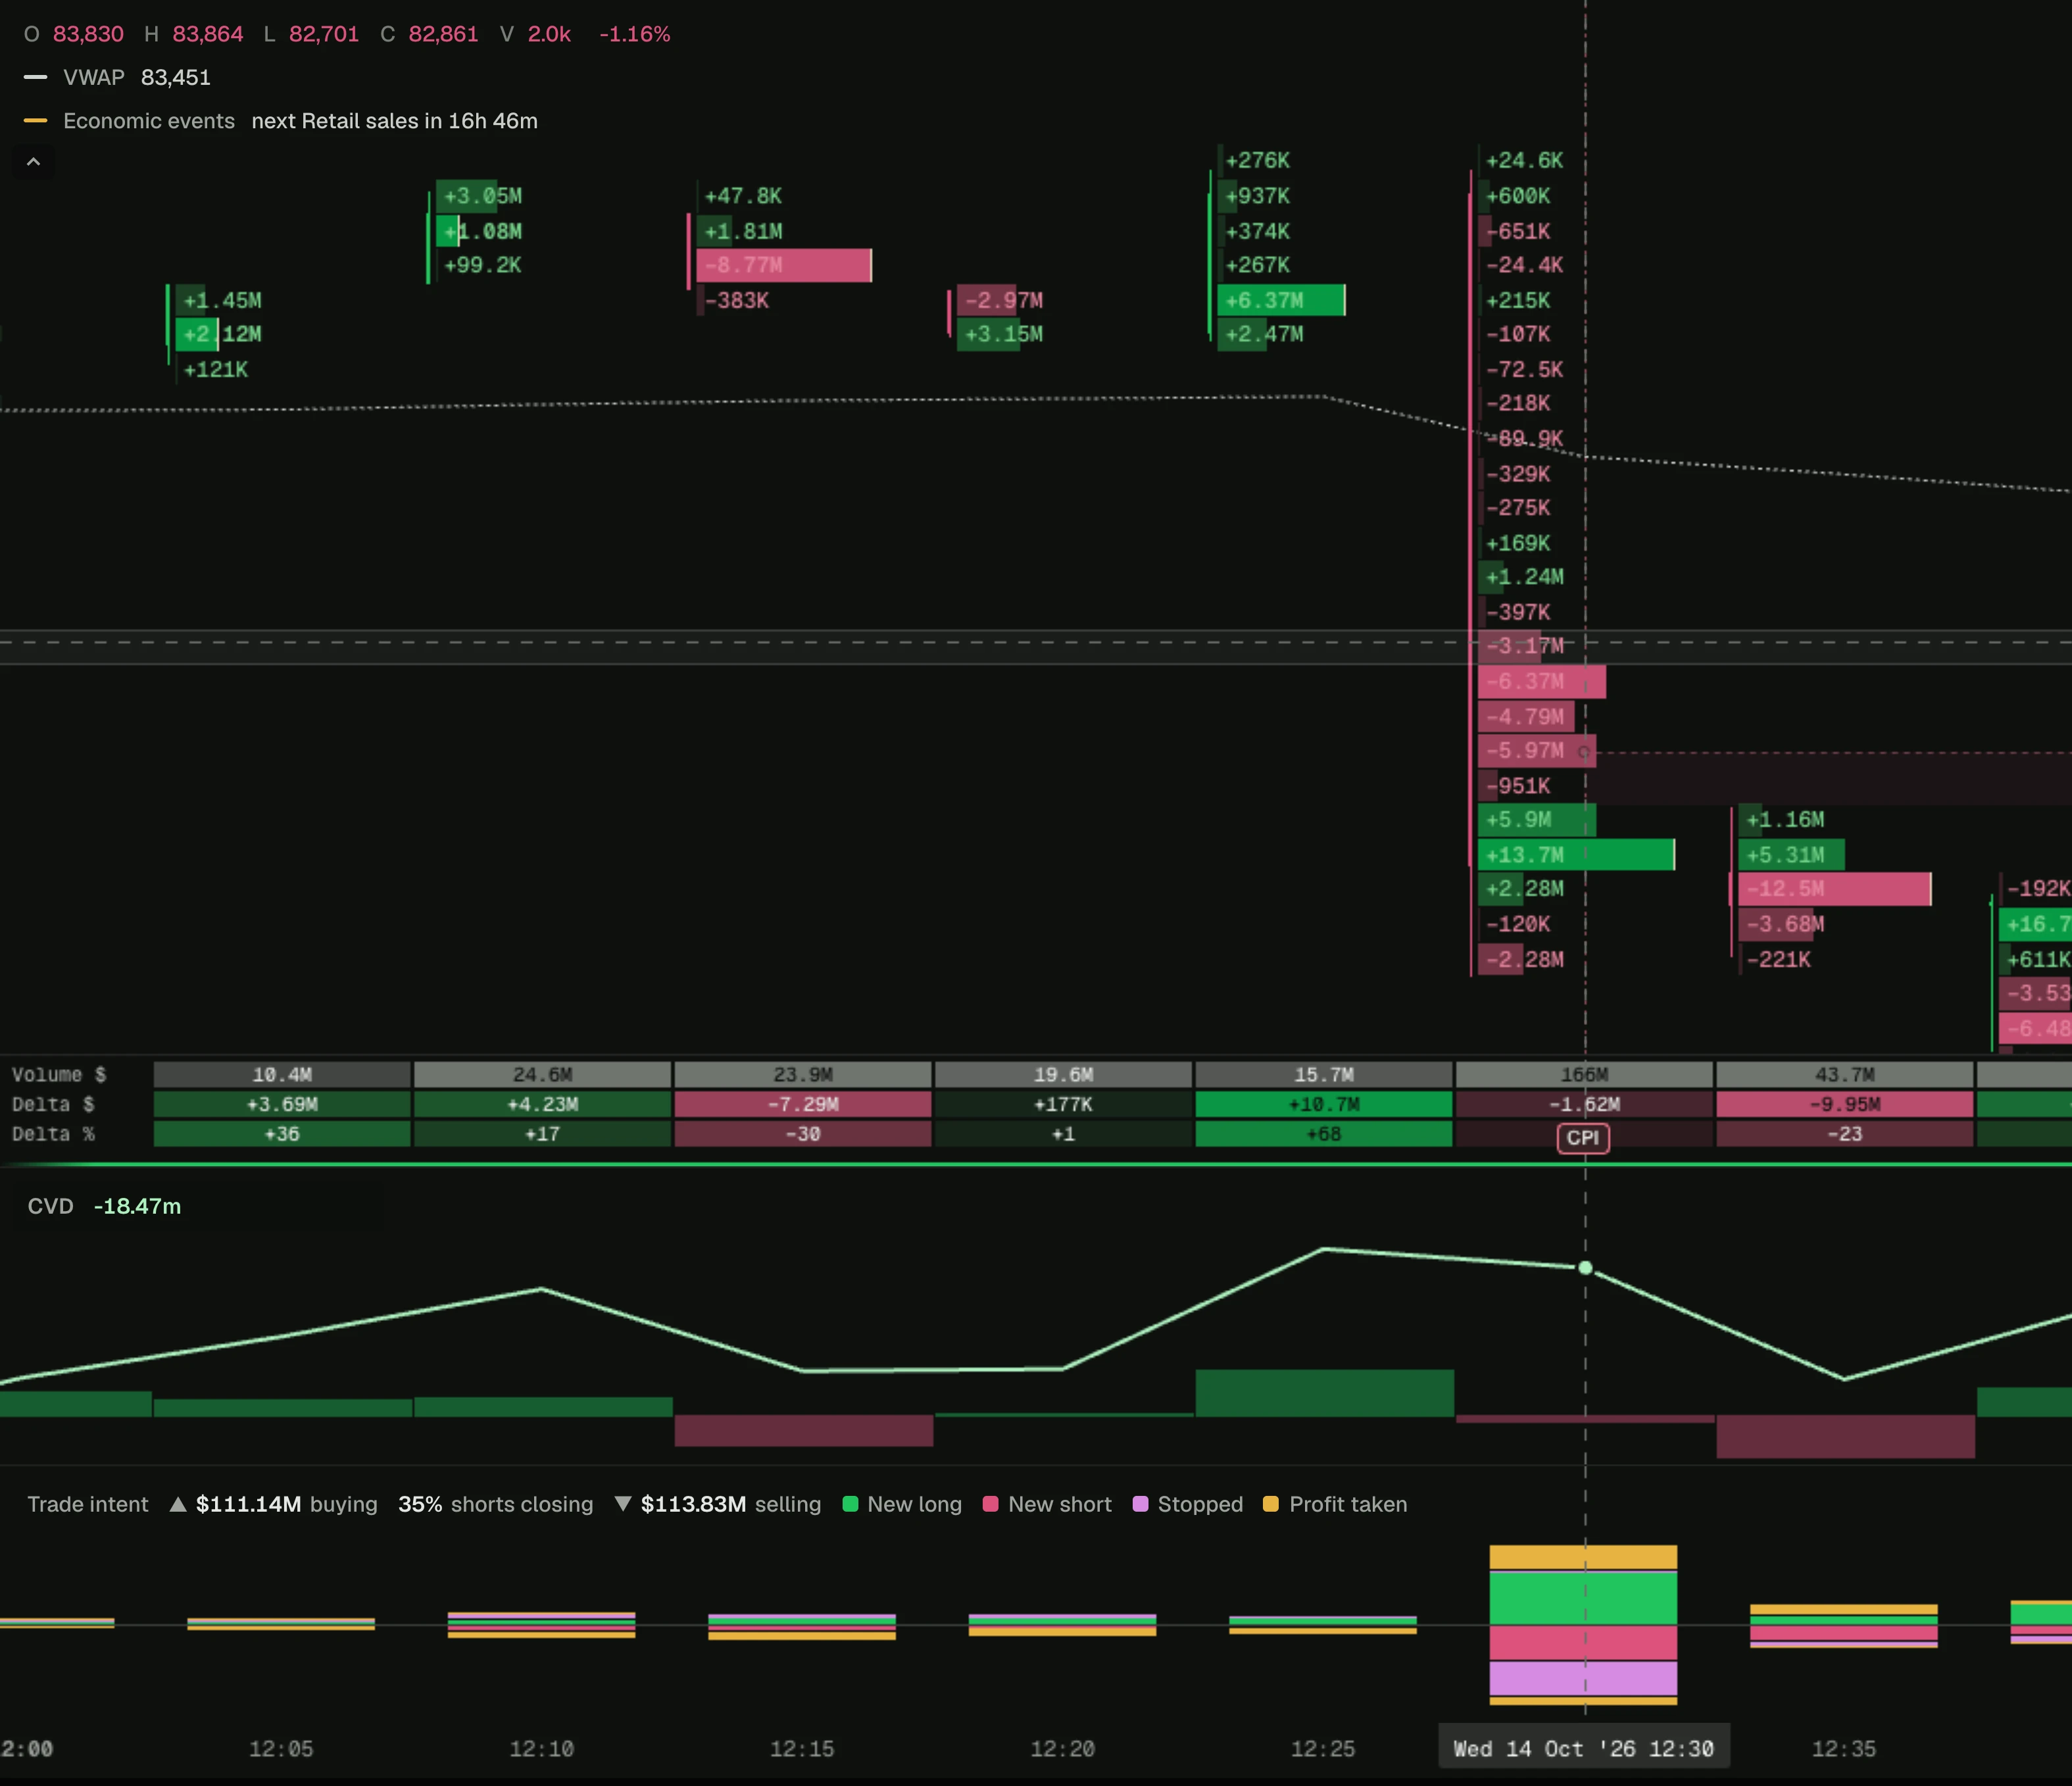
A bounce made of shorts closing reads differently from one made of new longs, and the pane shows which one you are in.
The crowd against the 100 largest positions
The Long/short panel counts every open position on a Hyperliquid market and splits it two ways: all accounts by count, and the 100 largest positions by value. One bar shows how far the largest 100 lean one way and everyone else the other. Two 7-day charts show how long the split has held.
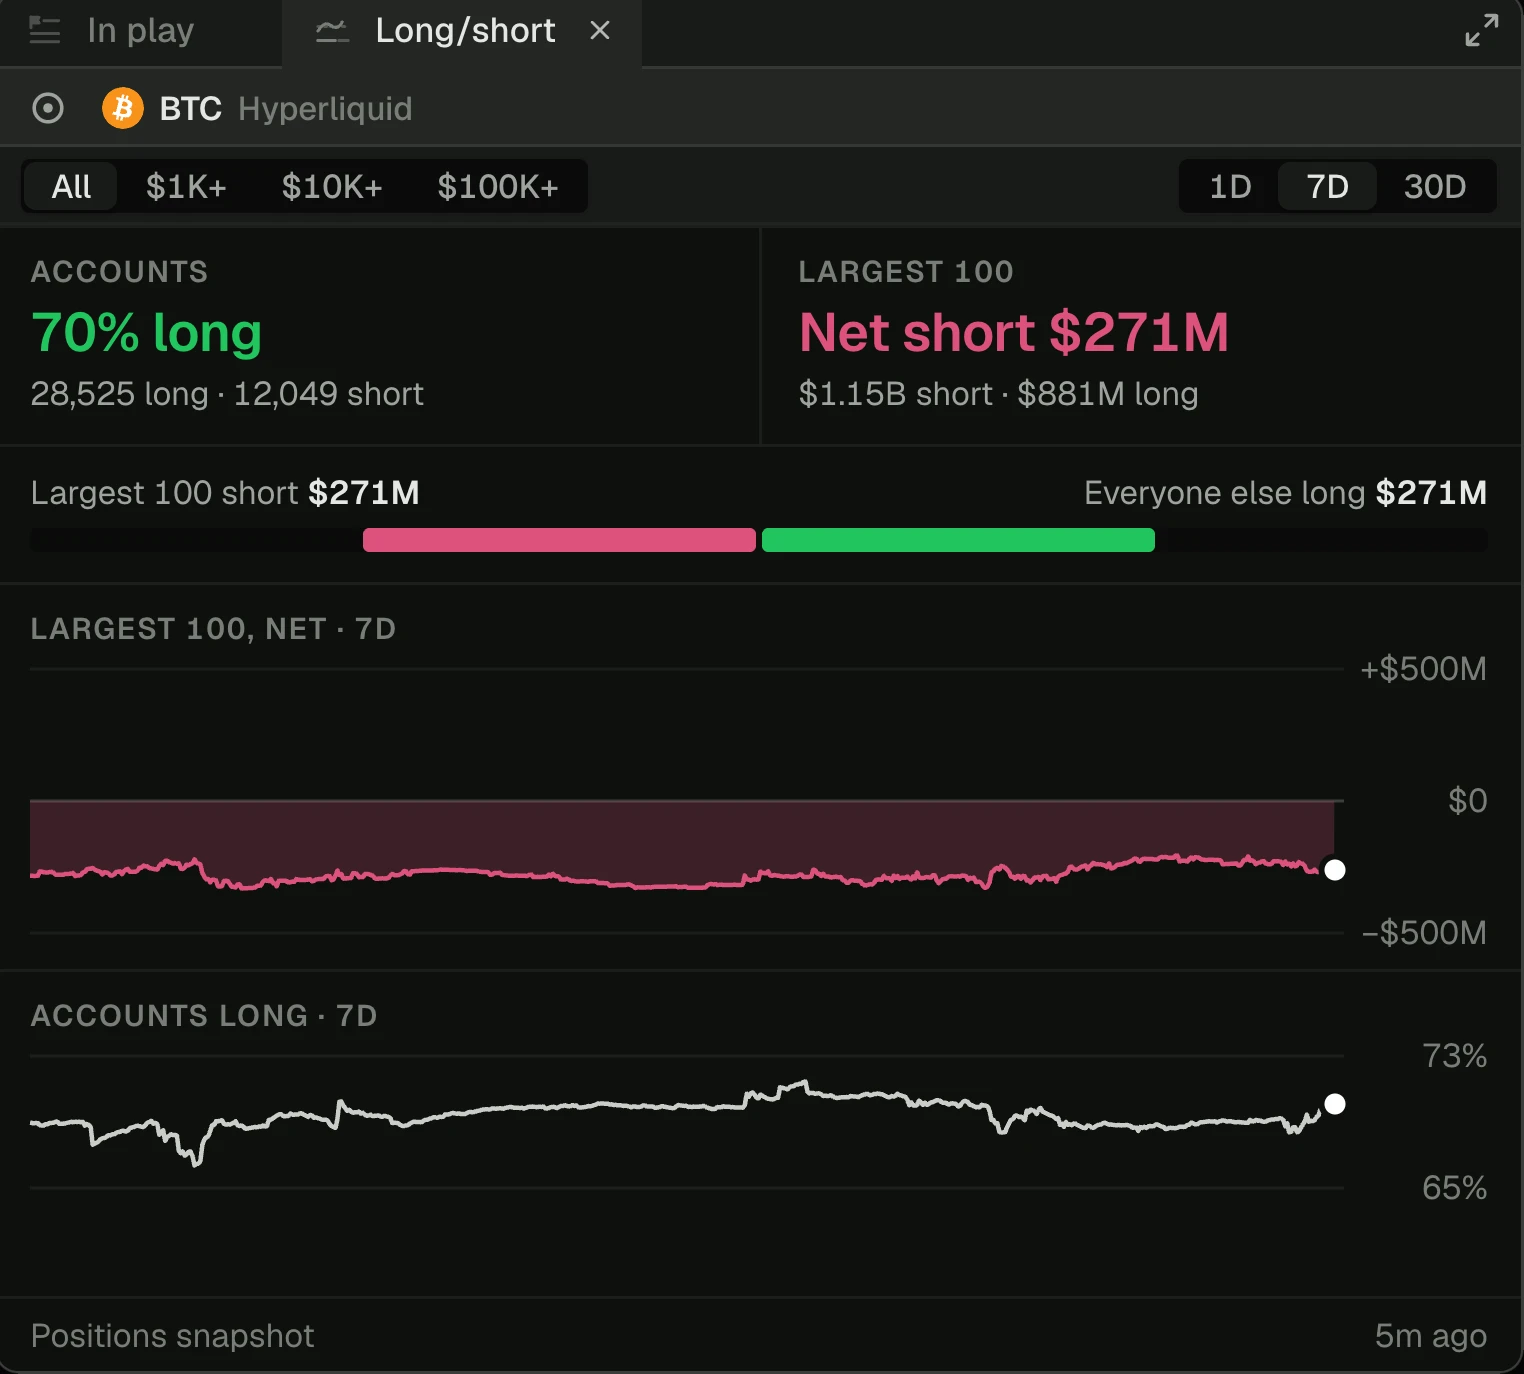
When most accounts lean one way and the biggest money leans the other, the panel puts both in one line.
A full charting terminal for Hyperliquid and Lighter comes with it
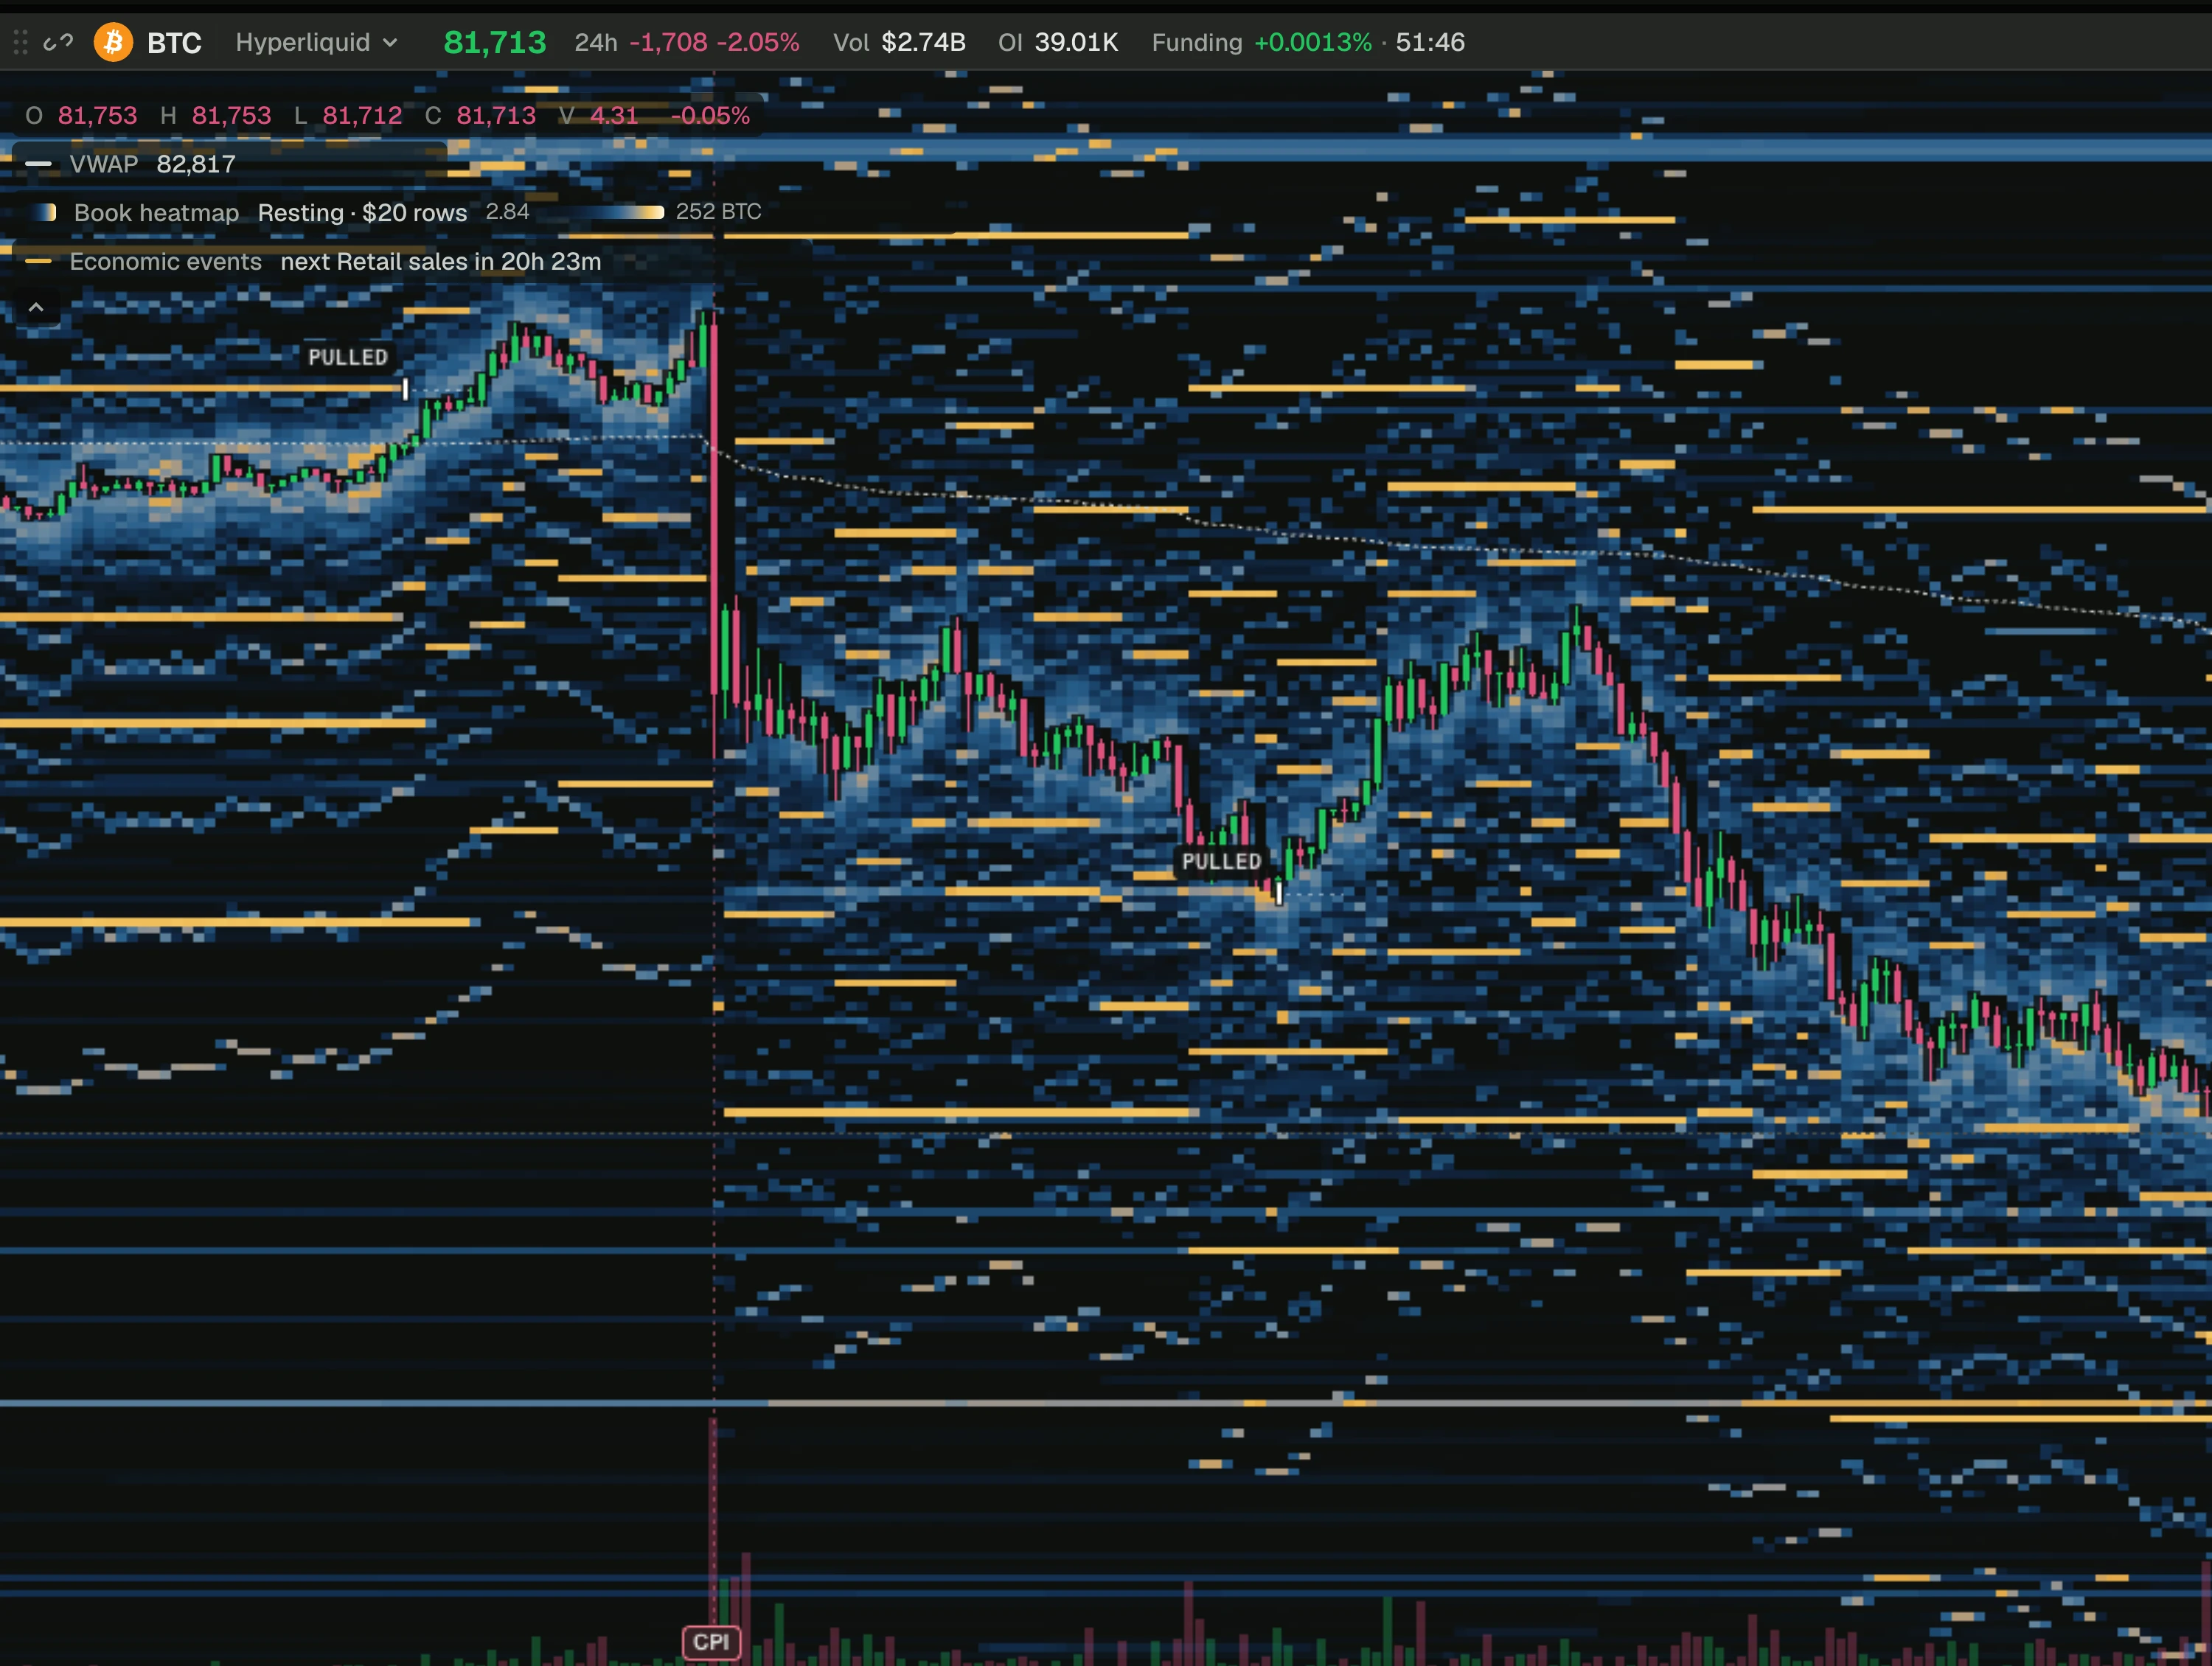
Under the wallet reads sits a complete terminal. Every Hyperliquid market, the HIP-3 stock and commodity perps included, gets footprint charts, market profile (TPO) and a book heatmap, with 30 days of order flow joined to the live tape. Paste your own Pine indicator from TradingView and it runs on the terminal's data.
| Feature | What you get |
|---|---|
| Order flow | Footprint, TPO and book heatmap on Hyperliquid |
| Indicators | Your Pine indicators, 120+ built in |
| Paper trading | $10,000 that fills against the live book |
| Layouts | Up to 8 linked charts, dockable panels |
| Alerts | Price alerts, to Telegram and Discord on Hyperliquid |
| Lighter | Charts, the book and paper trading |
Everything above works without an account. A free 0xArchive account adds two things: price alerts sent to Telegram or Discord with the tab closed, and layouts that follow you to another device. Open the terminal.
Run this analysis from an agent
The positions and order-level data under the terminal's wallet reads are in the 0xArchive API. Connect the 0xArchive MCP server and ask it for a market's positions or a wallet's orders. The Claude Code skill covers the same data from the terminal you code in, and the MCP, CLI and agent workflows guide walks through the whole loop.
Route references
For current API availability and plan details, use the Hyperliquid data API, data catalog, pricing, and status.