
From Blockworks Research by Shaunda Devens, republished on 0xArchive. Seven of the 25 figures in this report visibly cite 0xArchive as a data source. Read the original article.
Key Takeaways
- Hyperliquid is beginning to monetize the HFT layer of its exchange. Priority fees directly price faster execution, queue position, and earlier access to pending flow. Ordering-related fees represented roughly 80% of Ethereum and Solana REV in H1 2026, compared with only 6.7% of Hyperliquid revenue over the last 30 days.
- Priority fees are already a meaningful revenue line. Since launching in April, they have generated $5.07M, including $2.75M over the latest 30 days, equivalent to a $33.5M annualized run rate. HIP-3 markets generated 61% of write-priority revenue, highlighting priority fees as an important monetization layer for high-volume, growth-mode RWA markets where lower base fees and deployer fee sharing limit direct trading-fee capture.
- Adoption remains early, but current users already return most of their measured edge to the protocol. Daily participation averages only 194 write-priority users and 3.5 read-priority users against 89.7K daily active users. However, across six high-fee markets with delta-neutral top payers, IOC fees absorbed 69% of measured gross HFT returns.
- The addressable opportunity is materially larger across both write and read priority. We identify $365K per day of observable short-horizon write edge, of which Hyperliquid currently captures only 15% through IOC fees and 22% through ALO fees. Read priority already generates a $13.1M annualized run rate from only two seats, while 23 of 27 free sentry endpoints are full. At 25% to 75% write-edge capture and 5 to 25 read seats, priority fees support $54M to $148M of annualized revenue.
- Under our modeled case, Hyperliquid’s annualized revenue run rate nearly doubles from $498M in July to $979M by December 2026. Priority-fee revenue rises from $32M to $87M, while monthly revenue from non-core lines nearly quadruples from $8.8M to $33.7M. Hyperliquid continues to build a more diversified and less cyclical revenue base, reducing its reliance on core crypto trading fees.
An Introduction to Base and Priority Fees
Blockchains monetize demand for blockspace through two distinct fee layers. The first is standard usage: users pay for inclusion, execution, and settlement. On Ethereum and Solana, this takes the form of transaction fees. On Hyperliquid, whose core application is a protocol-native central limit order book, the comparable base revenue line is maker and taker fees on matched trading volume.
The second, more economically concentrated layer comes from transaction ordering. Temporary inefficiencies, including liquidations, oracle-update backruns, cross-venue arbitrage, sandwich attacks, and stale liquidity, create high-value opportunities where execution speed determines who captures the edge.
Sophisticated traders compete for these opportunities. Because block producers control transaction inclusion and ordering, searchers bid for favorable placement through priority fees, validator tips, or private bundle payments, such as Ethereum builder payments and Solana Jito tips. Traders therefore pay not only for blockspace, but also for sequencing rights, sharing part of the expected return with the actors who control ordering.
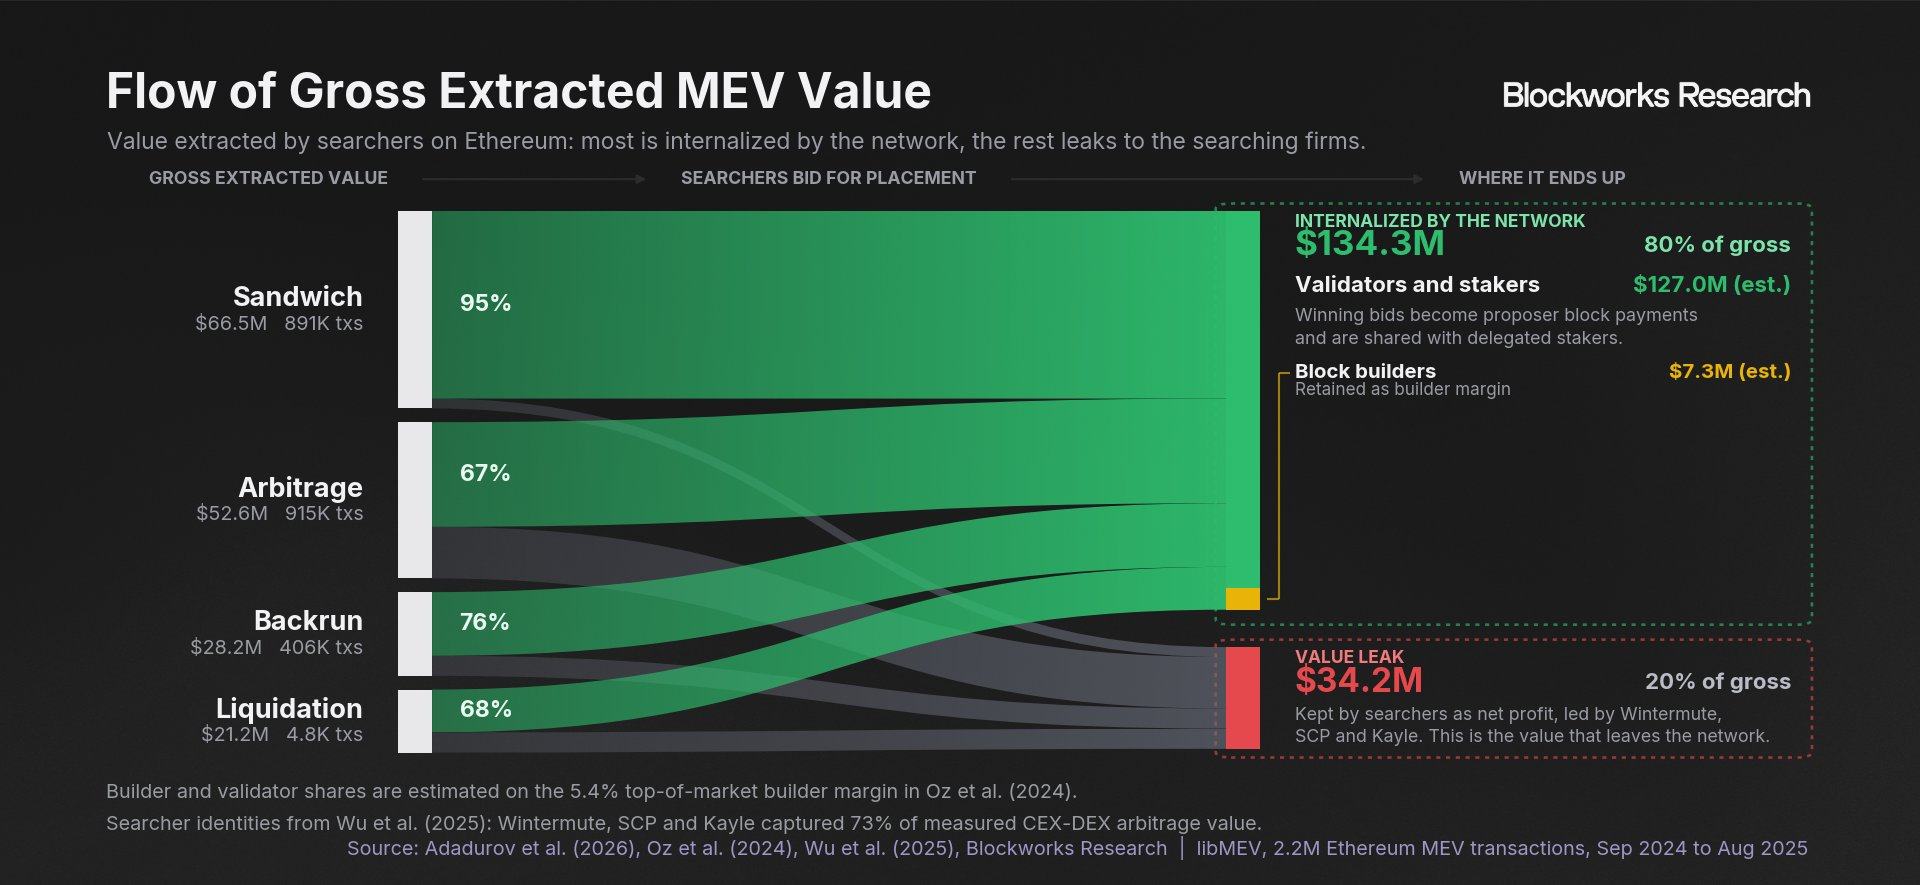
Because only one transaction can capture a given opportunity, searchers often surrender much of their gross edge to the blockspace supply chain. In an analysis of 2.2 million Ethereum MEV transactions, Adadurov et al. (2026) found average bribe ratios of 95% for sandwich attacks, 76% for backruns, 68% for liquidations, and 67% for arbitrage.
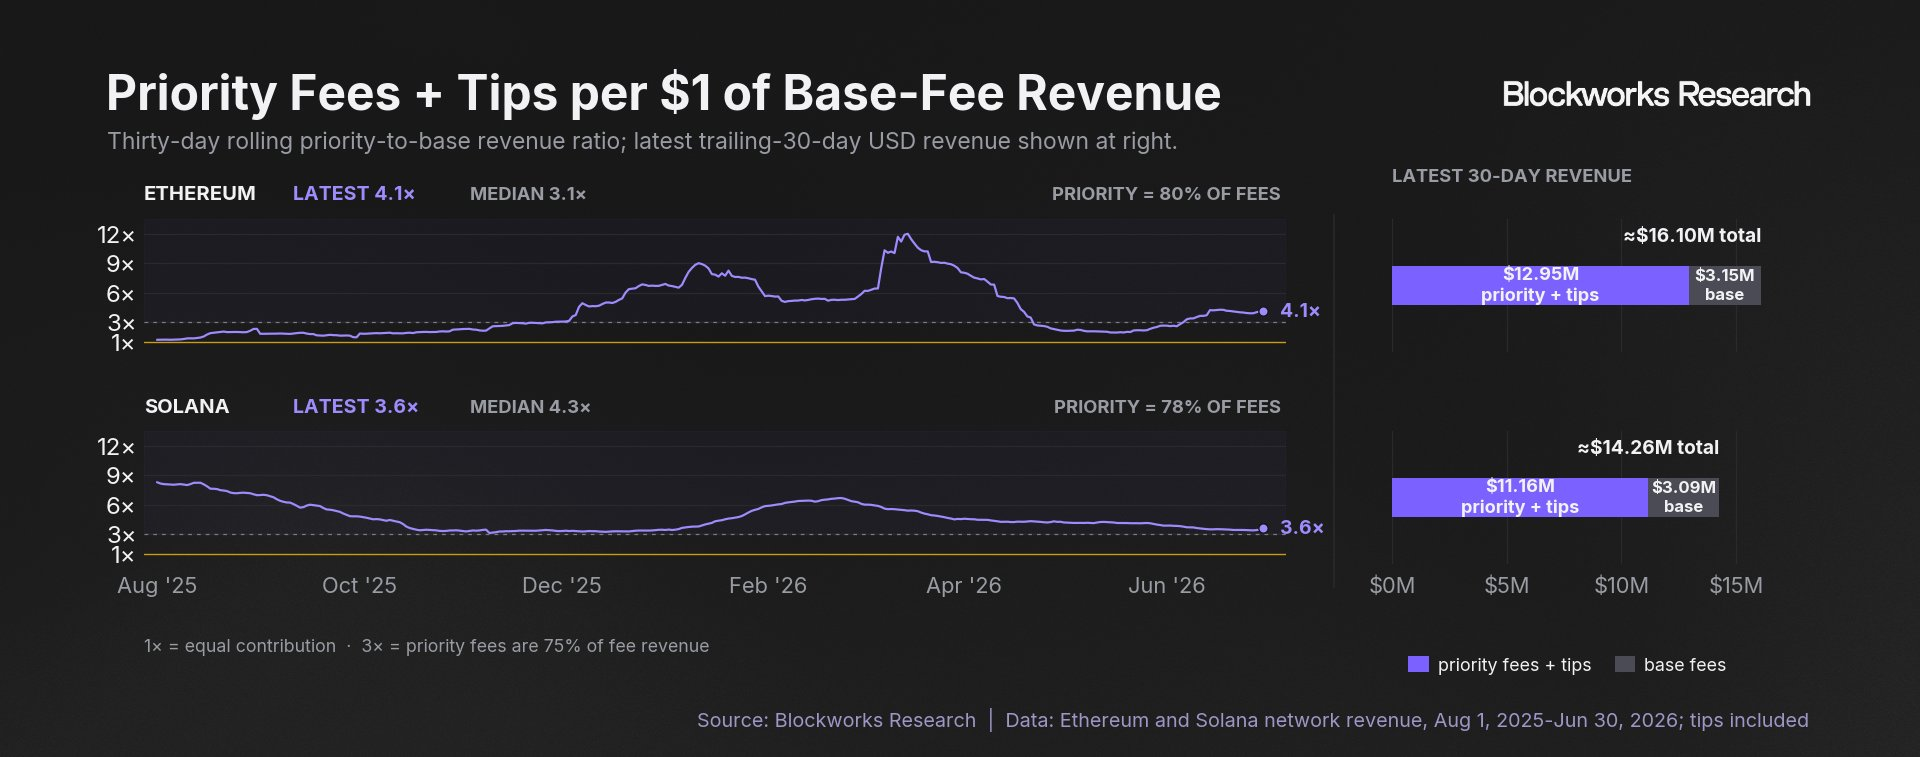
This supports a useful mental model: base fees price generic access to blockspace, while priority fees price access to high-value ordering opportunities. In H1 2026, ordering-related fees represented 79.6% of Ethereum's REV, including 54% from priority fees and 25% from MEV-Boost tips. They represented 82.9% of Solana's REV, including 62% from priority fees and 21% from Jito tips. Base fees contributed one-fifth or less on both chains.
Transaction Ordering in Traditional Markets
Similar opportunities exist on traditional venues, where stale quotes, cross-venue dislocations, and short-lived arbitrage attract the same class of latency-sensitive traders. High-frequency trading, built around capturing these small but repeatable edges, is a >$10B annual industry.
Unlike L1s, traditional exchanges do not allow traders to bid directly for transaction placement. Orders are matched by price-time priority, so competition shifts from explicit ordering fees to latency infrastructure: who can observe and respond to exchange data fastest.
That competition operates at microsecond scale. London Stock Exchange message data show that an average FTSE 100 stock experienced 537 latency races per day, roughly one per minute, with a modal gap of 5 to 10 microseconds between the winner and first loser (Aquilina, Budish, and O'Neill, QJE 2022). The top six firms won 82% of races. The same firms also raced defensively, attempting to cancel stale quotes in roughly 35% of races before those quotes could be picked off. Across global equities, these races are estimated to be worth $5B annually.
To compete at those speeds, trading firms invest in co-location, direct market-data feeds, private wireless networks, and low-latency routing. Virtu Financial, one of the few publicly listed electronic market makers, reported $66.9M of communication and data-processing expense in Q1 2026, up 11.9% year over year. The company characterizes this line as primarily fixed costs for co-location, connectivity, and market data.
Exchanges capture part of this spending. At major venues such as NYSE and Nasdaq, core low-latency access costs roughly $10K to $25K per month. Data and connectivity services generated approximately 13% of ICE's gross exchange-segment revenue in 2025. This is largely fixed access revenue and does not scale with the economic value of each contested trade. Traditional exchanges therefore monetize access but never internalize the venue's most valuable layer: the inefficiencies inside it.
Transaction Ordering on Hyperliquid
For Hyperliquid, directly monetizing ordering creates a product-design risk. Priority fees are among the most valuable revenue lines for general-purpose L1s, but on a central limit order book they can impair the product if they alter how economically distinct actions interact with the book.
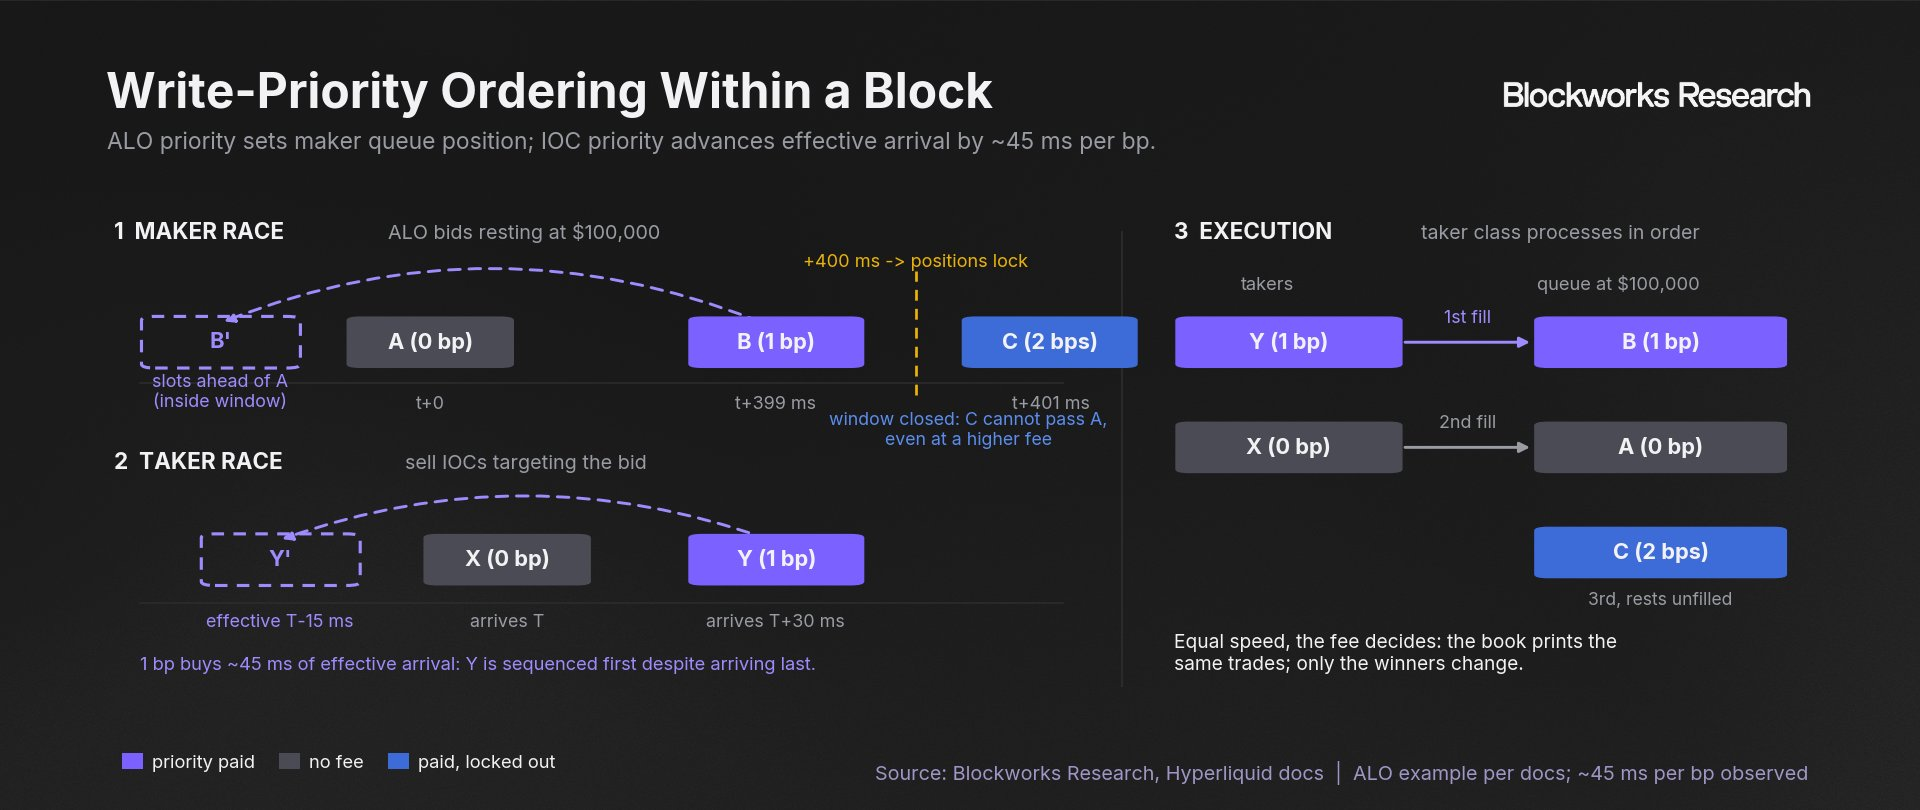
Hyperliquid addresses this by ranking actions according to their capacity to take liquidity. Within each consensus batch, actions are processed in three classes:
- Actions that cannot take liquidity are processed first. These actions submit no GTC or IOC order and include post-only ALO placements, such as a bid at $100,000 that rests rather than crosses. Because they cannot execute against resting liquidity, they create no immediate adverse-selection risk.
- Cancels are processed second. A maker's cancel reaches the book before taker-capable flow in the same batch can interact with the quote.
- Taker-capable actions are processed last. Any action containing at least one GTC or IOC order falls into this class and may remove liquidity.
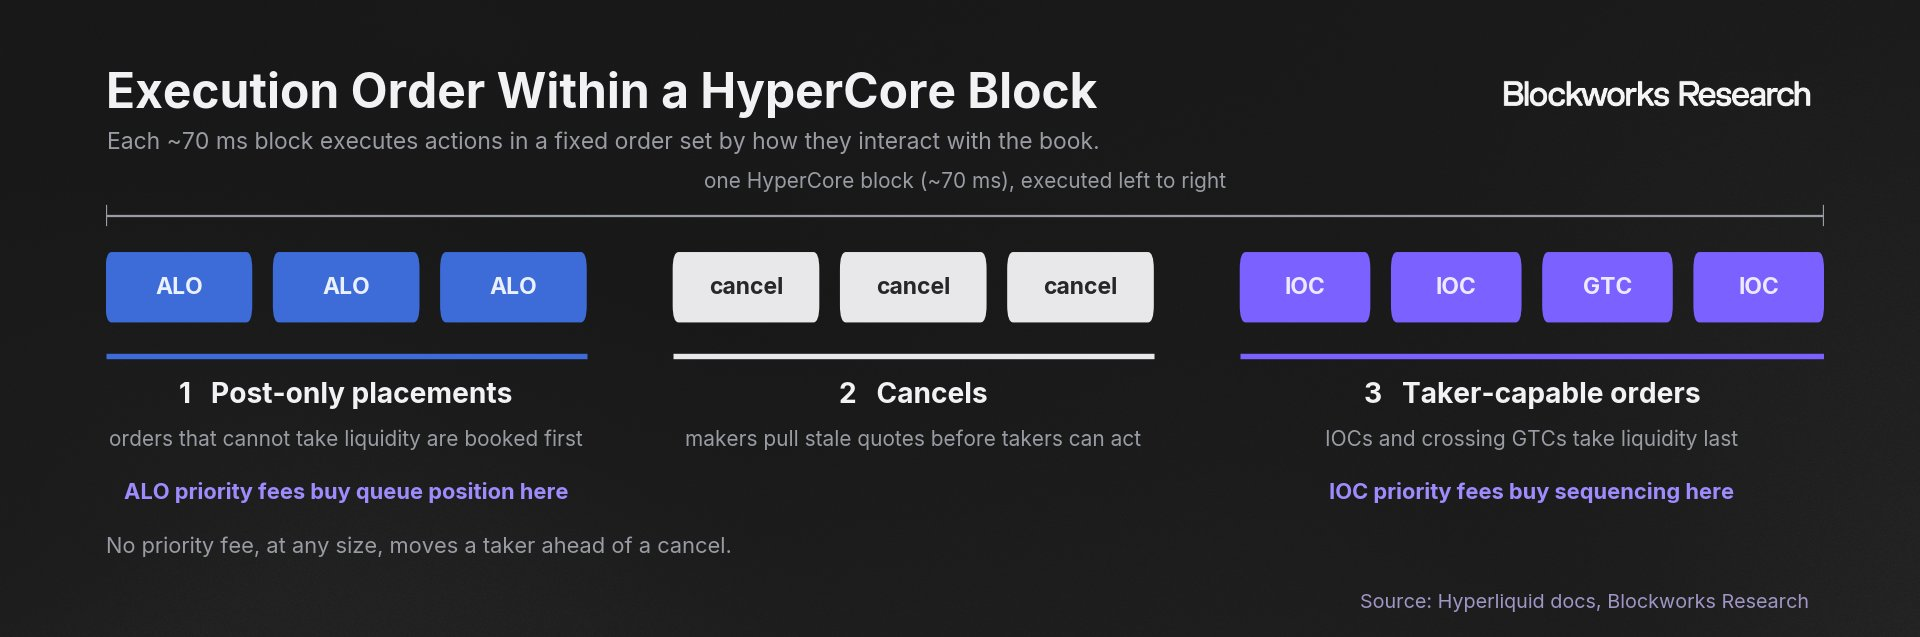
Competition is limited within each action class, affecting only the ordering of economically similar actions. This allows Hyperliquid to monetize scarce execution opportunities without changing the underlying market structure.
Write Priority Fees
Within each action class, traders can attach priority fees to move their orders ahead of competing actions in the same class. Because Hyperliquid sequences transactions before execution, relative position can be priced directly. Write priority takes two forms:
- IOC priority fees. These sequence aggressive orders ahead of competing aggressive flow. Each 1 bp shortens an order's effective arrival time by approximately 45 ms, up to saturation at 8 bps. Above that threshold, incremental fees no longer buy additional time preference, although they can still improve rank relative to other priority orders within the same block.
- ALO priority fees. ALO orders are post-only: they can join the book but cannot take liquidity. Unlike IOC priority, the fee does not accelerate transaction sequencing; it moves a new quote ahead of orders submitted at the same price within the previous 400 ms. Older quotes retain locked queue priority and cannot be overtaken.
Both mechanisms can operate within a single block: a priority ALO can improve a new maker order’s queue position, while a priority IOC can move ahead of competing taker flow.
Read Priority Fees
Hyperliquid also monetizes the read side of latency: how quickly a trader sees pending flow.
Gossip priority fees allow users to receive pending transactions before block inclusion and execution. Early visibility lets traders respond to expected flow by submitting orders in advance or cancelling quotes that the flow may render stale.
Access is deliberately limited. The current mechanism allocates two priority positions through independent Dutch auctions every three minutes. Each auction reopens at ten times its previous clearing price and decays toward a floor of 0.1 HYPE. Lower-priority positions receive pending flow later, creating distinct latency products rather than one undifferentiated data feed. Winning bidders register IP addresses onchain, and relaying nodes deliver pending transactions to those IPs earlier. Latency tests indicate an approximately 25 ms gap between priority levels. Fees are paid in HYPE from spot balances and burned.
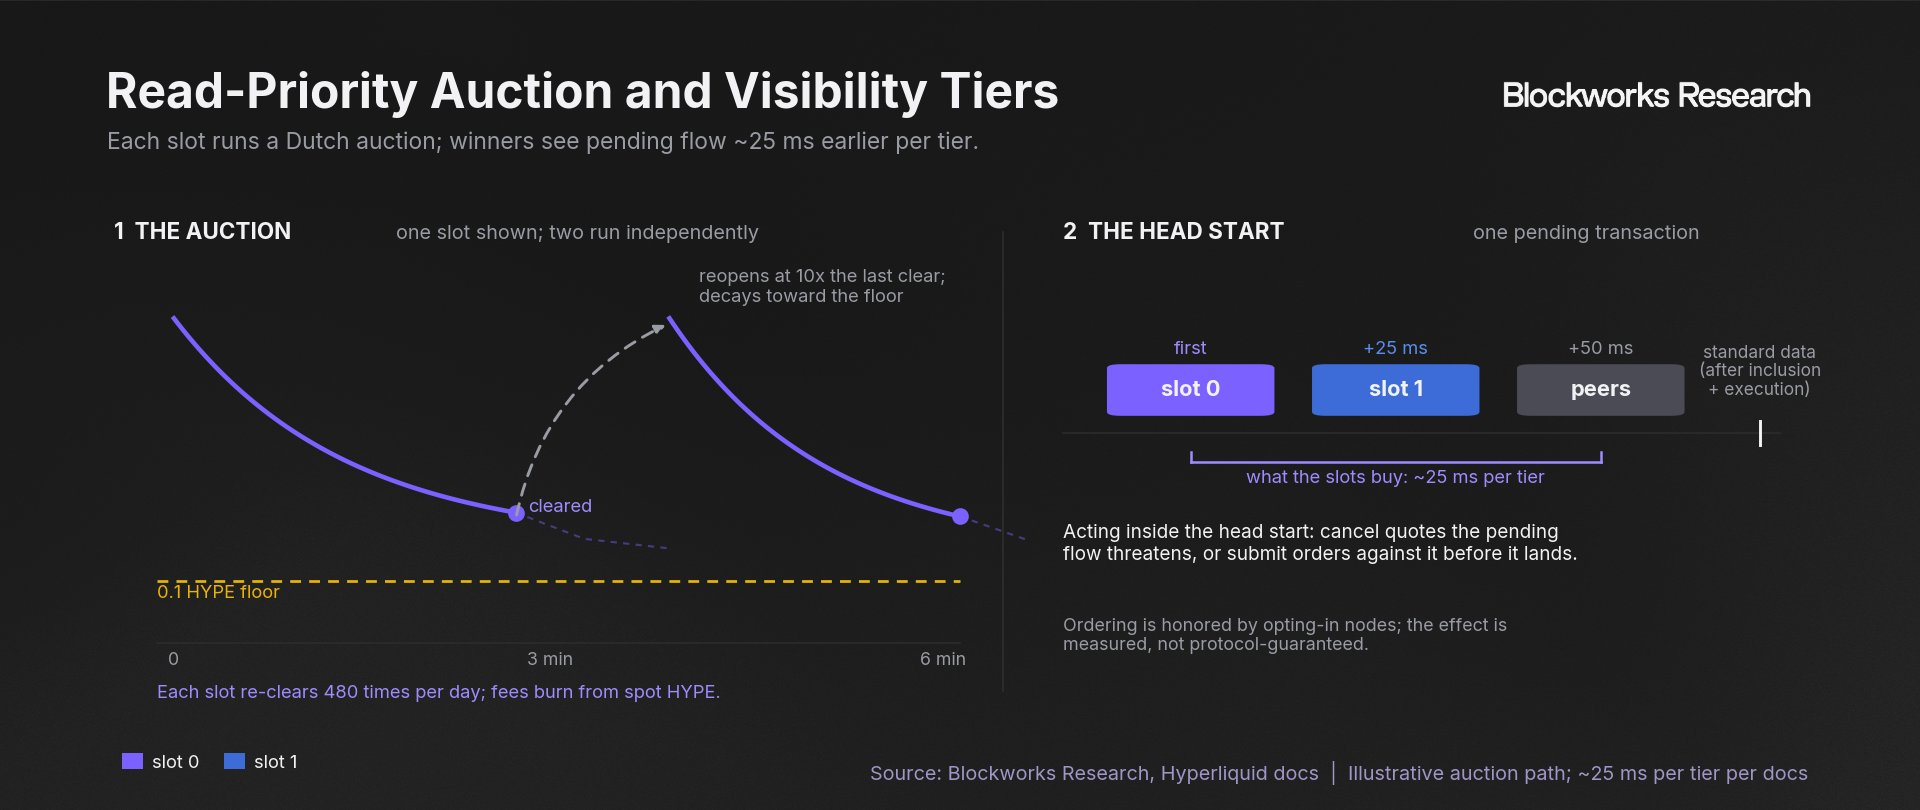
Together, write and read priority monetize both sides of latency: observing venue flow earlier and acting on it faster.
Measuring the Latency Stack
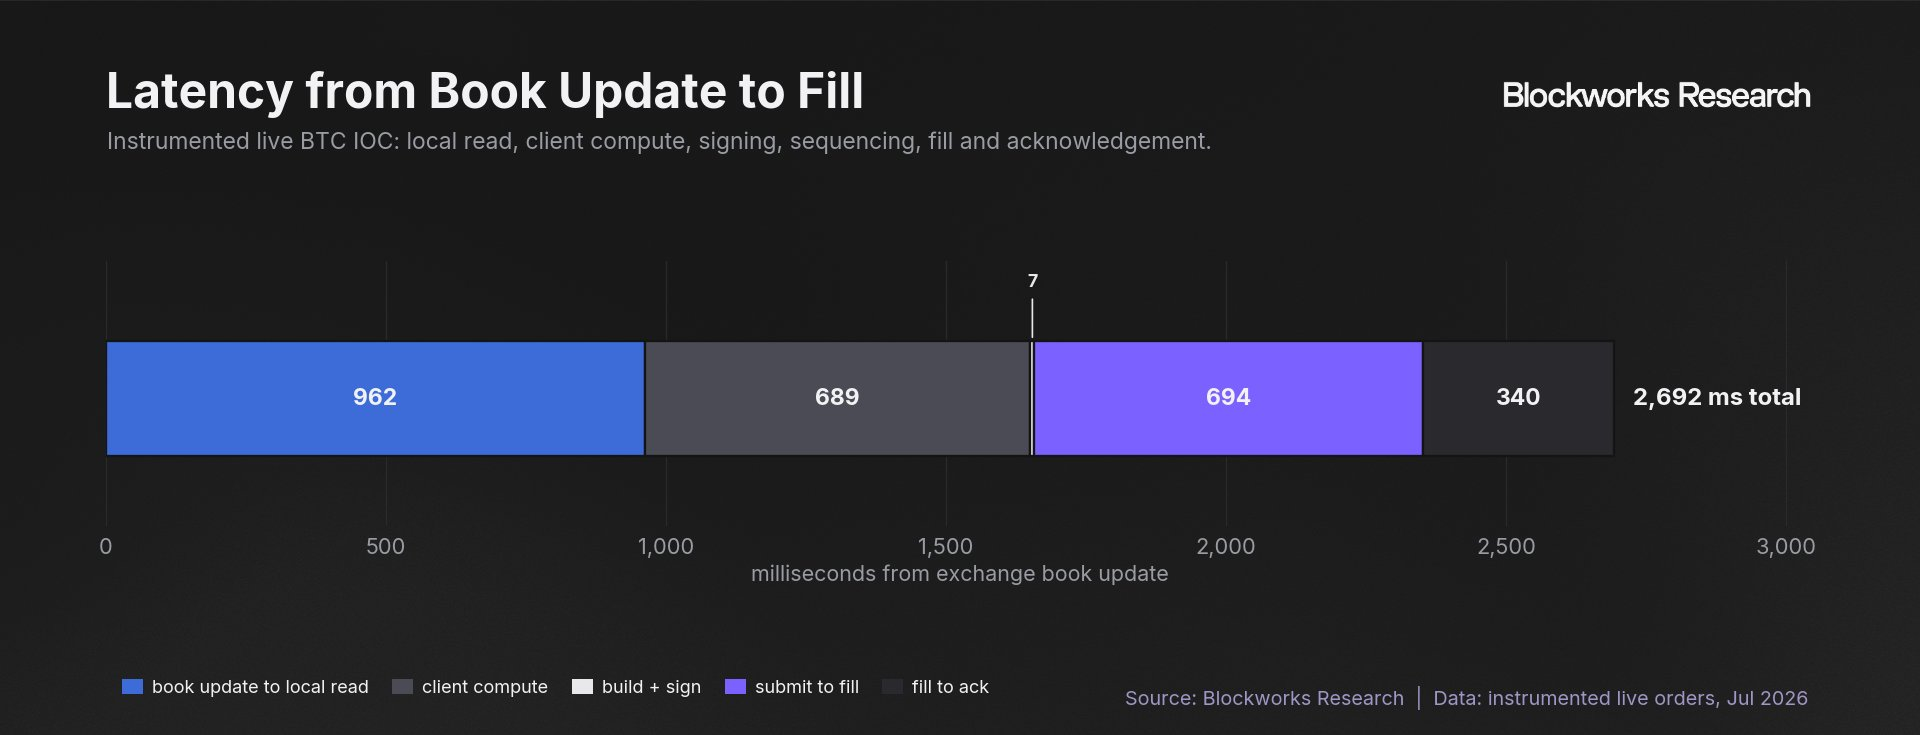
We tested these mechanisms on live BTC IOC orders to measure their practical effect across the full trade lifecycle: exchange book update, local receipt, decision and order construction, signing and submission, sequencing and fill, acknowledgement, and confirmation.
Our deliberately unoptimized baseline measured approximately 2.7 seconds of end-to-end latency. Most of the delay arose in four stages: reading data from the Hyperliquid API, constructing the order, submitting it, and waiting for sequencing and fill.
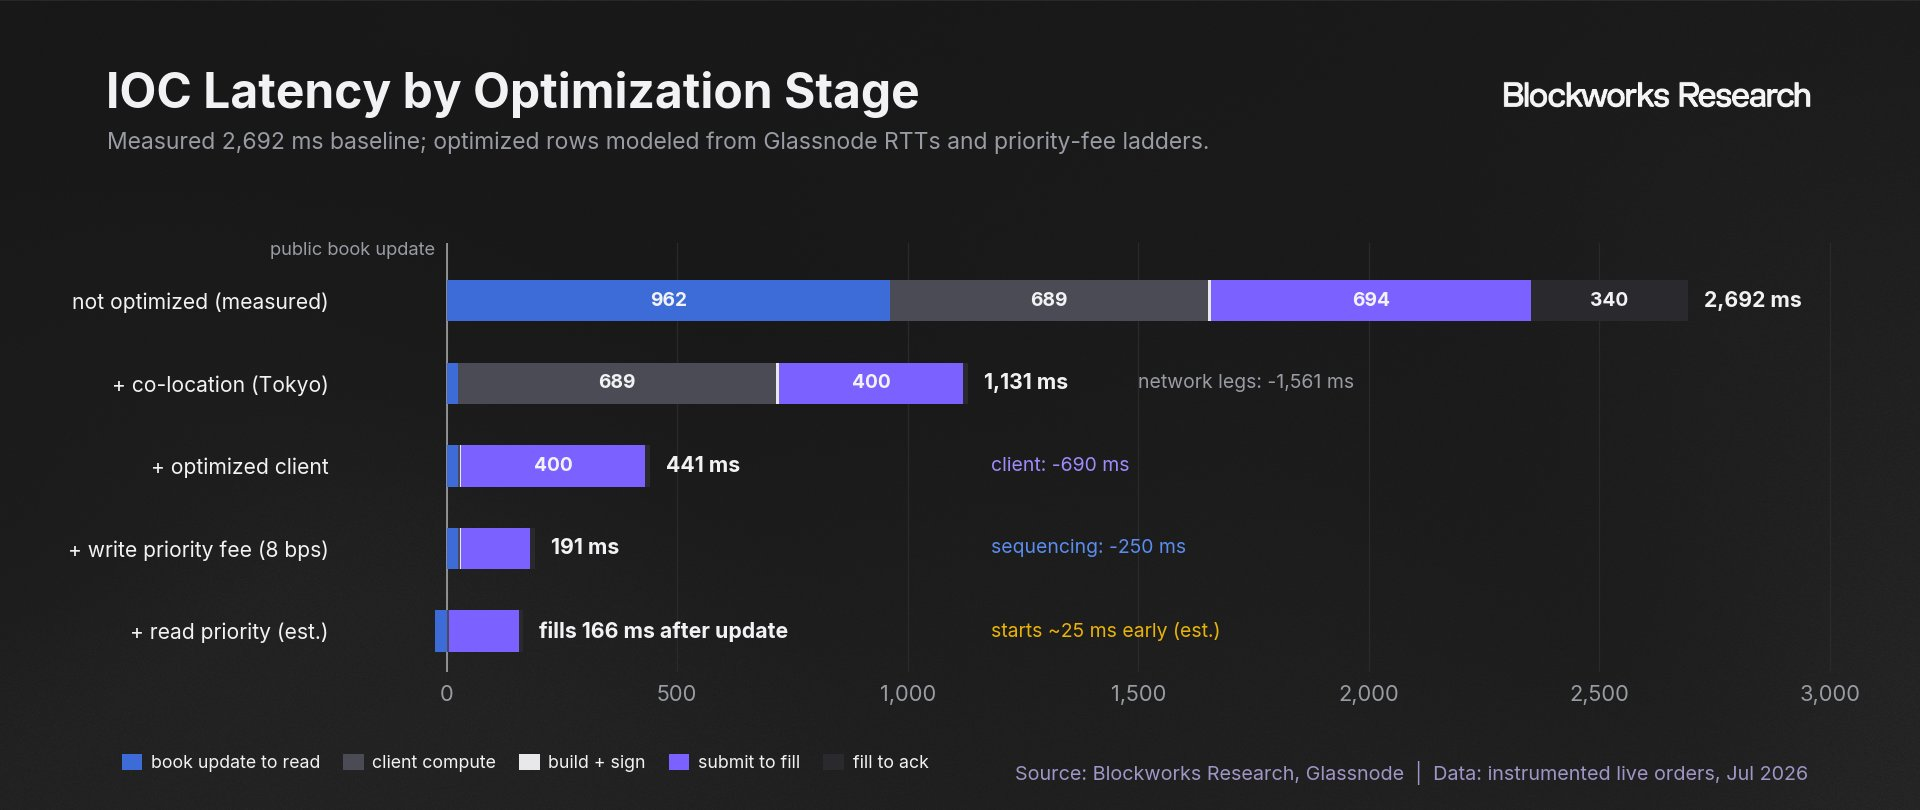
The principal improvements available to a trader are:
- Co-location. Running in AWS Tokyo, where validators cluster, reduced the API round trip from roughly 300 ms to under 5 ms. For a strategy that reacts to a book update and submits an order, this compresses the read and write legs by approximately 600 ms combined.
- Order construction. Client-side computation, sizing, and pre-trade checks all occur before submission. Our unoptimized harness spent 689 ms in this stage. An engineered system can reduce it to single-digit milliseconds.
- Write priority. Each 1 bp buys approximately 45 ms of observed sequencing advantage up to saturation at 8 bps. In our paired run, an 8 bps fee improved submit-to-fill time by 368 ms.
- Read priority. The gossip auction delivers pending transactions before execution, with an observed advantage of approximately 25 ms per priority level.
Applied sequentially to the same live BTC order, each improvement compressed the loop further. Most latency remains in external infrastructure and client engineering, while priority fees price the final sequencing advantage inside the protocol.
Economic Effects of Priority Fees
Priority fees convert part of the competition that would otherwise be expressed through greater infrastructure spending into a protocol-level fee paid in HYPE and burned. The lower layers of the latency stack remain external: co-location and client-side computation still sit outside the venue. At the most competitive margin, particularly in contested markets and short-lived opportunities, Hyperliquid now prices earlier access to its own flow and faster action on that flow.
Priority fees also change how systematic edge is distributed. Low-latency strategies capture small positive-expected-value trades repeatedly and at scale. If a trade offers 2 bps of expected gross edge, a trader paying 1 bp can outrank an equally fast competitor paying nothing. Rivals must match the fee at a lower net return or forgo the contested fill. As competition deepens, a larger share of gross edge can be bid away into protocol fees.
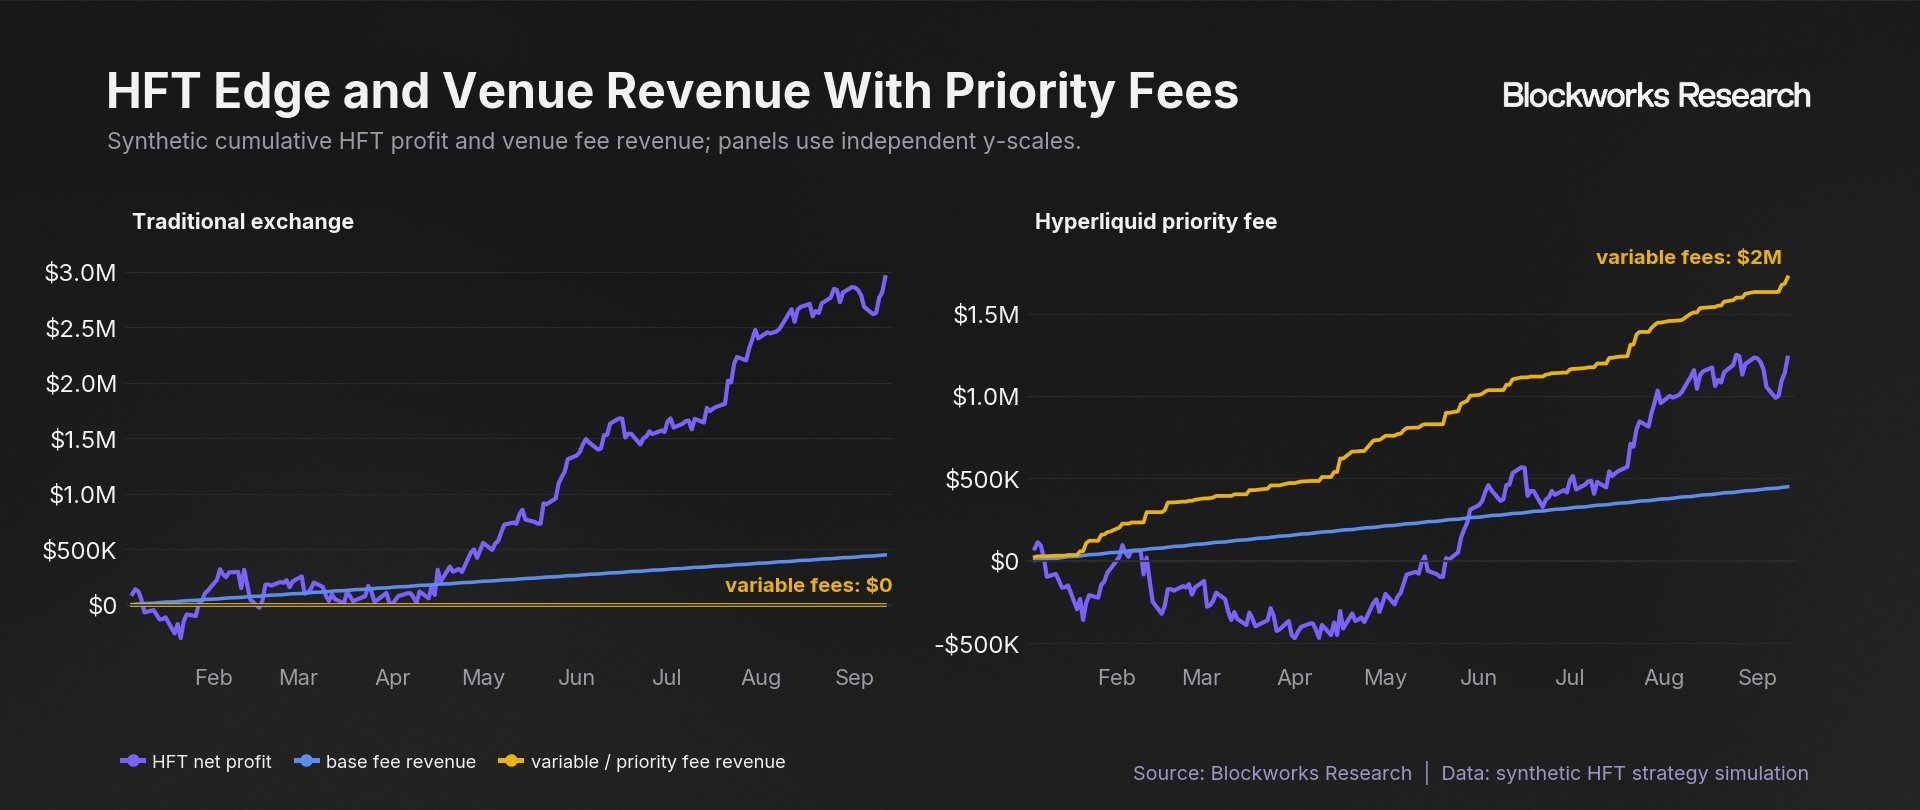
The same logic applies on the maker side. Market makers quoting at the same price can pay for earlier queue position and a higher probability of capturing the next fill.
Hyperliquid therefore monetizes both layers of blockspace demand: trading fees price access, while priority fees price ordering. By allowing traders to compete within each action class, Hyperliquid captures part of the HFT layer that traditional venues monetize only indirectly through fixed access products. And, unlike off-protocol payments to validators, Hyperliquid's priority fees follow protocol-level rules and are burned in HYPE, adding a distinct source of tokenholder value accrual alongside core trading fees.
The Impact of Priority Fees on Protocol Revenue
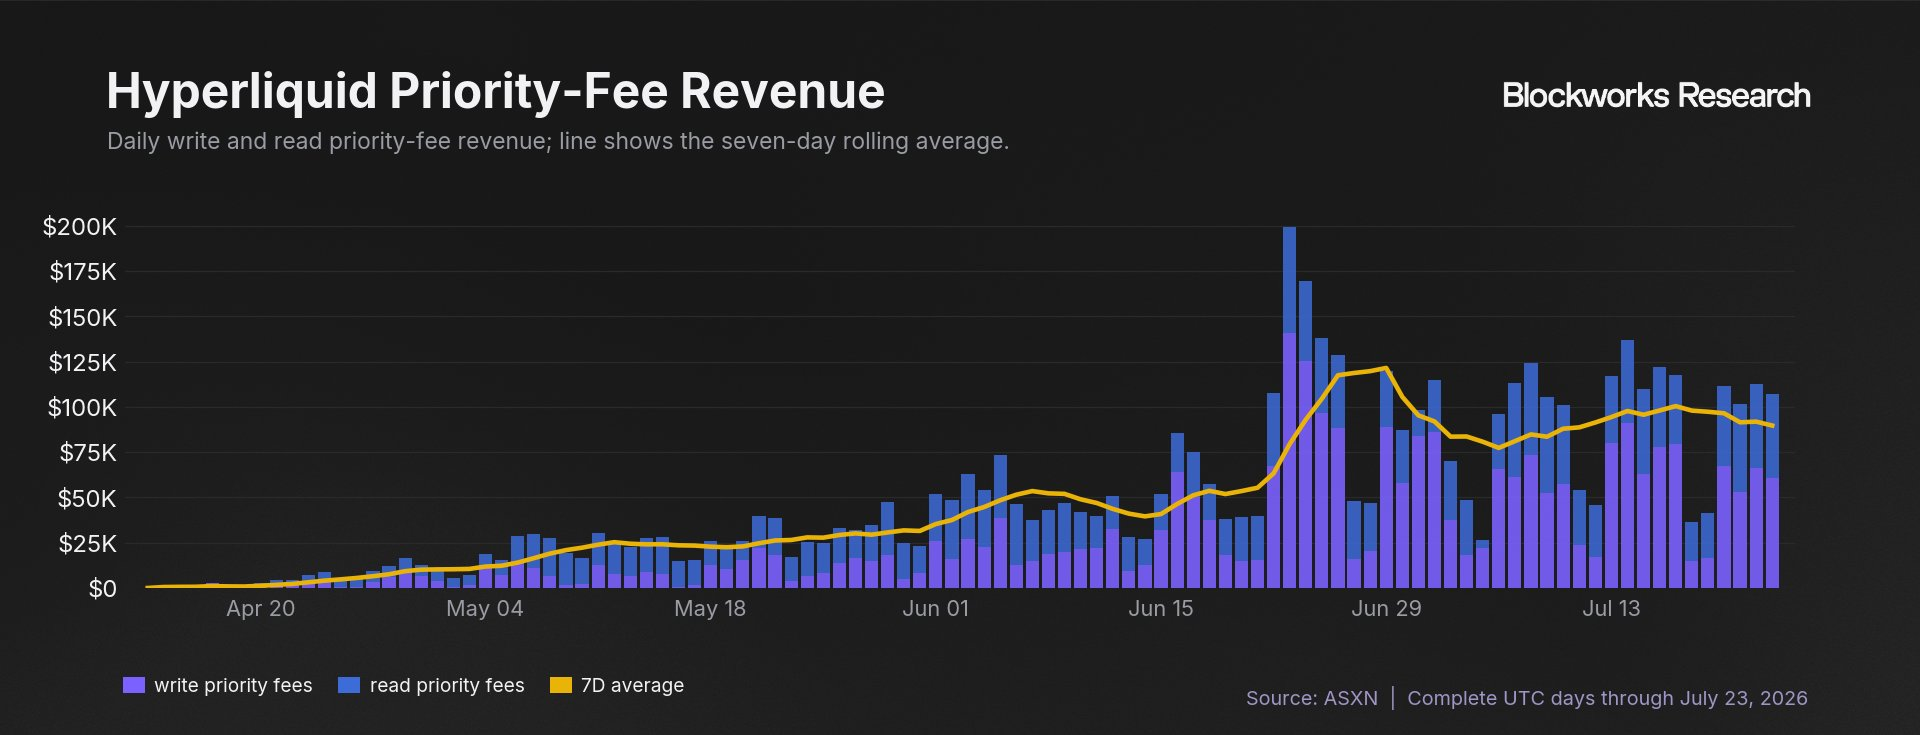
Since launching on April 13, 2026, priority fees have generated $5.07M: $2.83M from write priority and $2.24M from read priority. Over the latest 30 days, they generated $2.75M, or 6.7% of total revenue, equivalent to a $33.5M annualized run rate.
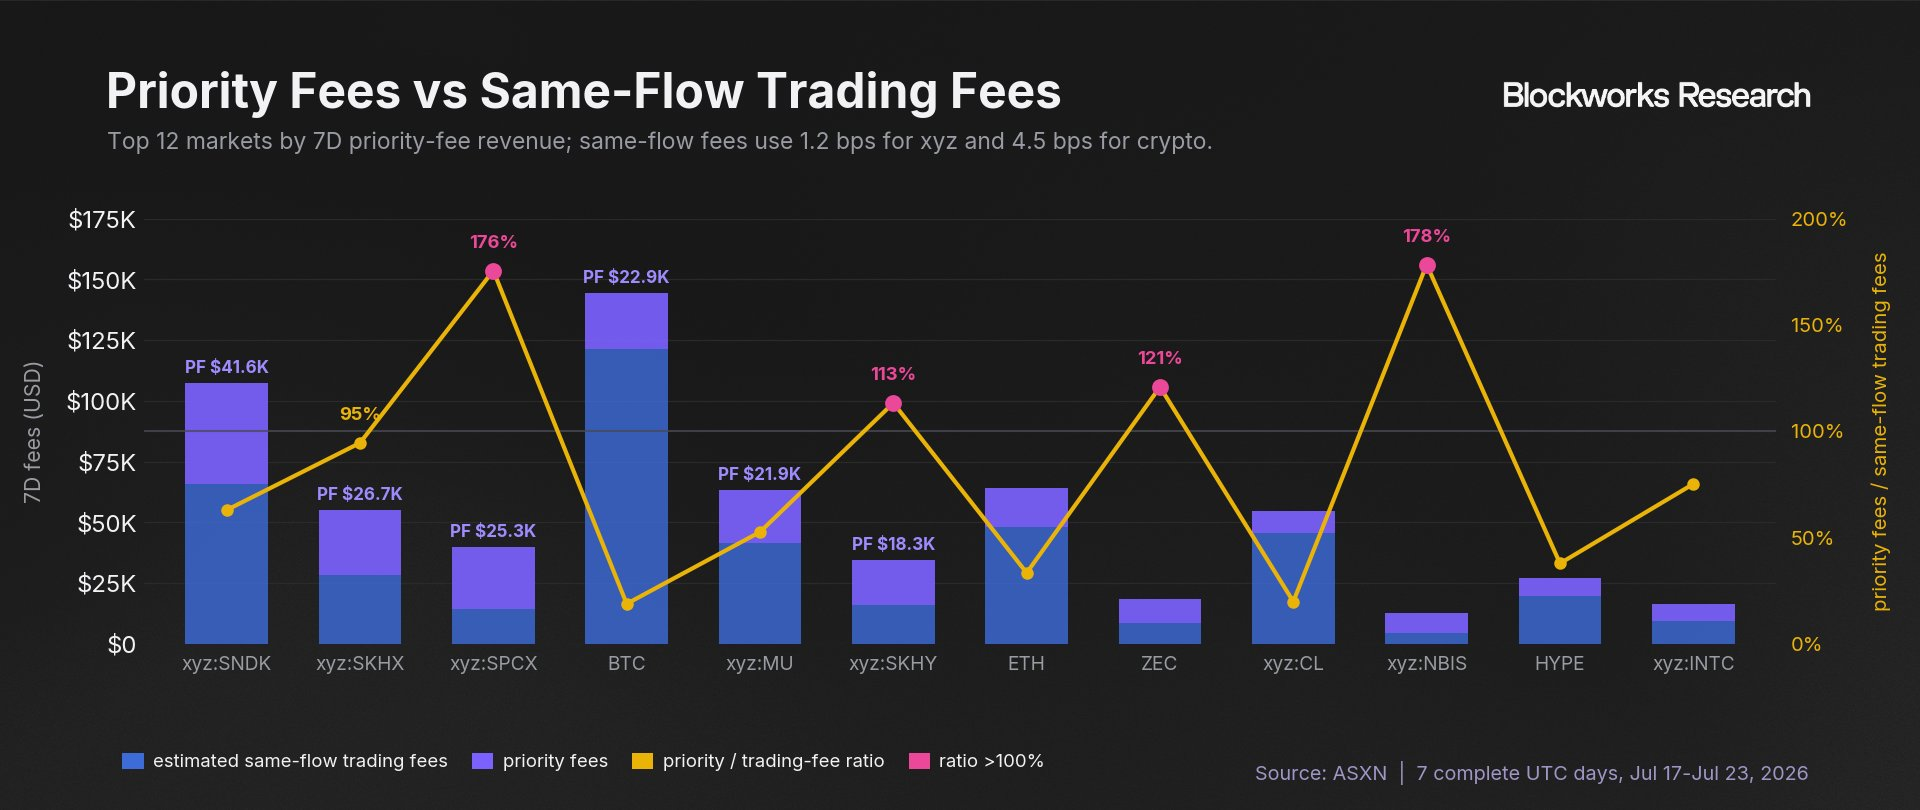
Monetization is strongest relative to trading revenue in several newer HIP-3 markets. Across the latest 30 days, HIP-3 markets generated $1.06M of write-priority revenue, or 61% of total write-priority revenue. Over the last seven complete days, write-priority fees exceeded estimated trading-fee revenue in NBIS, SPCX, and SKHY, and nearly matched it in SKHX. This gives Hyperliquid an alternative monetization path for HIP-3 markets, where base fees are lower and trading revenue is split with deployers.
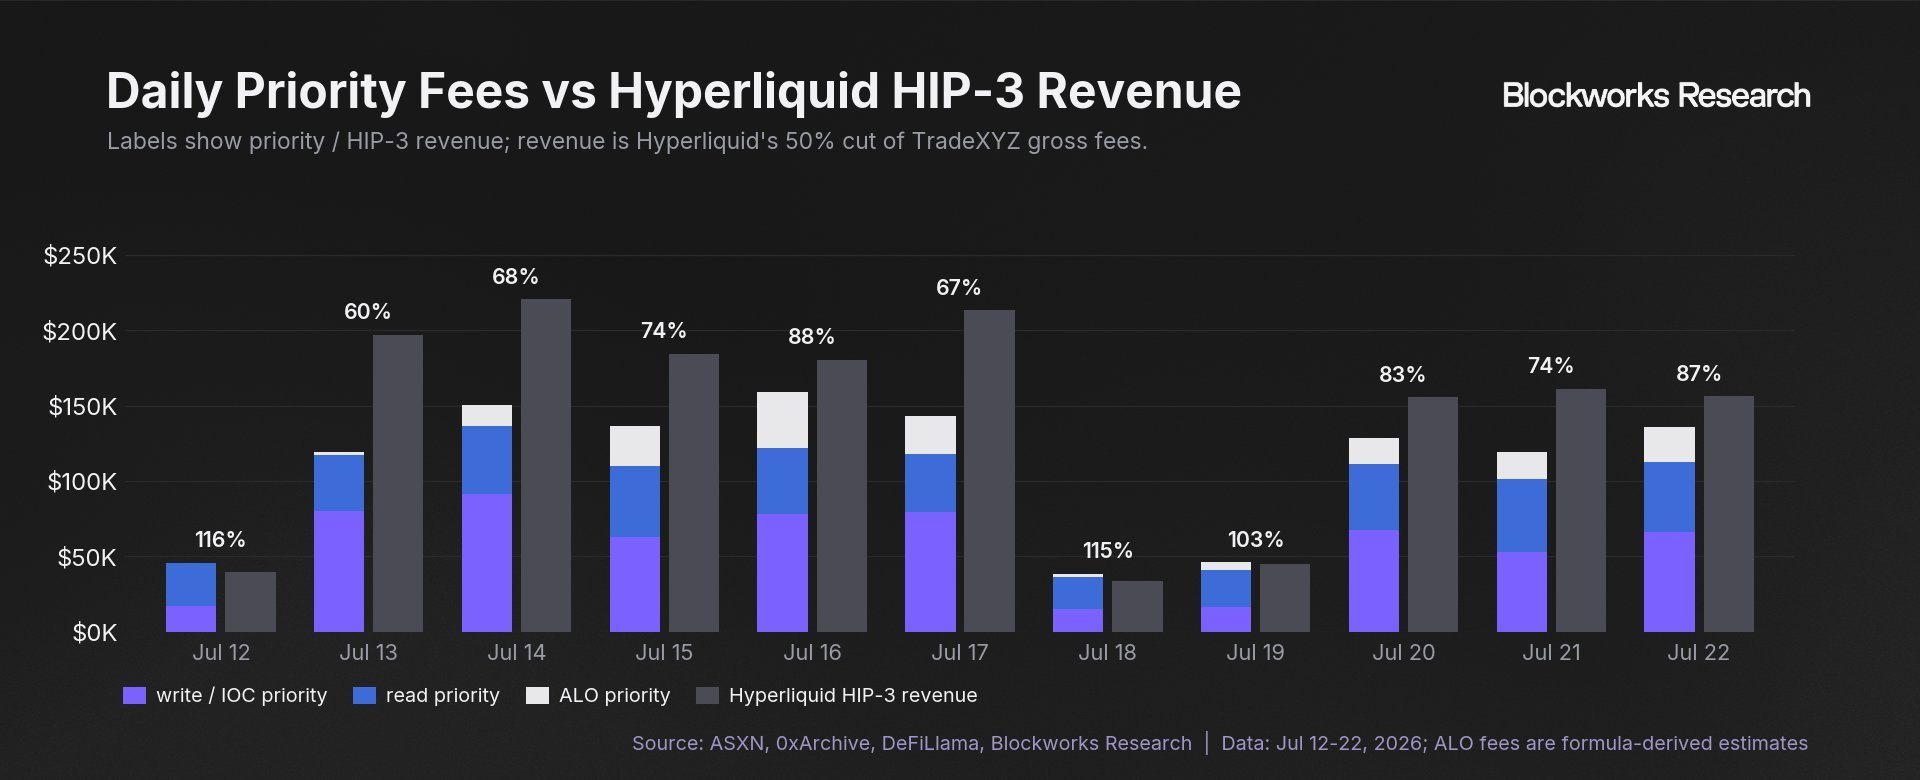
Priority-fee monetization nevertheless remains early. Ordering-related fees account for roughly 80% of REV on Ethereum and Solana, compared with 6.7% of Hyperliquid revenue over the latest 30 days. To assess the forward opportunity, we examine current adoption, estimate the IOC and ALO edge pools these fees target, and model how much of that edge competition could return to the protocol.
Current Adoption of Priority Fees
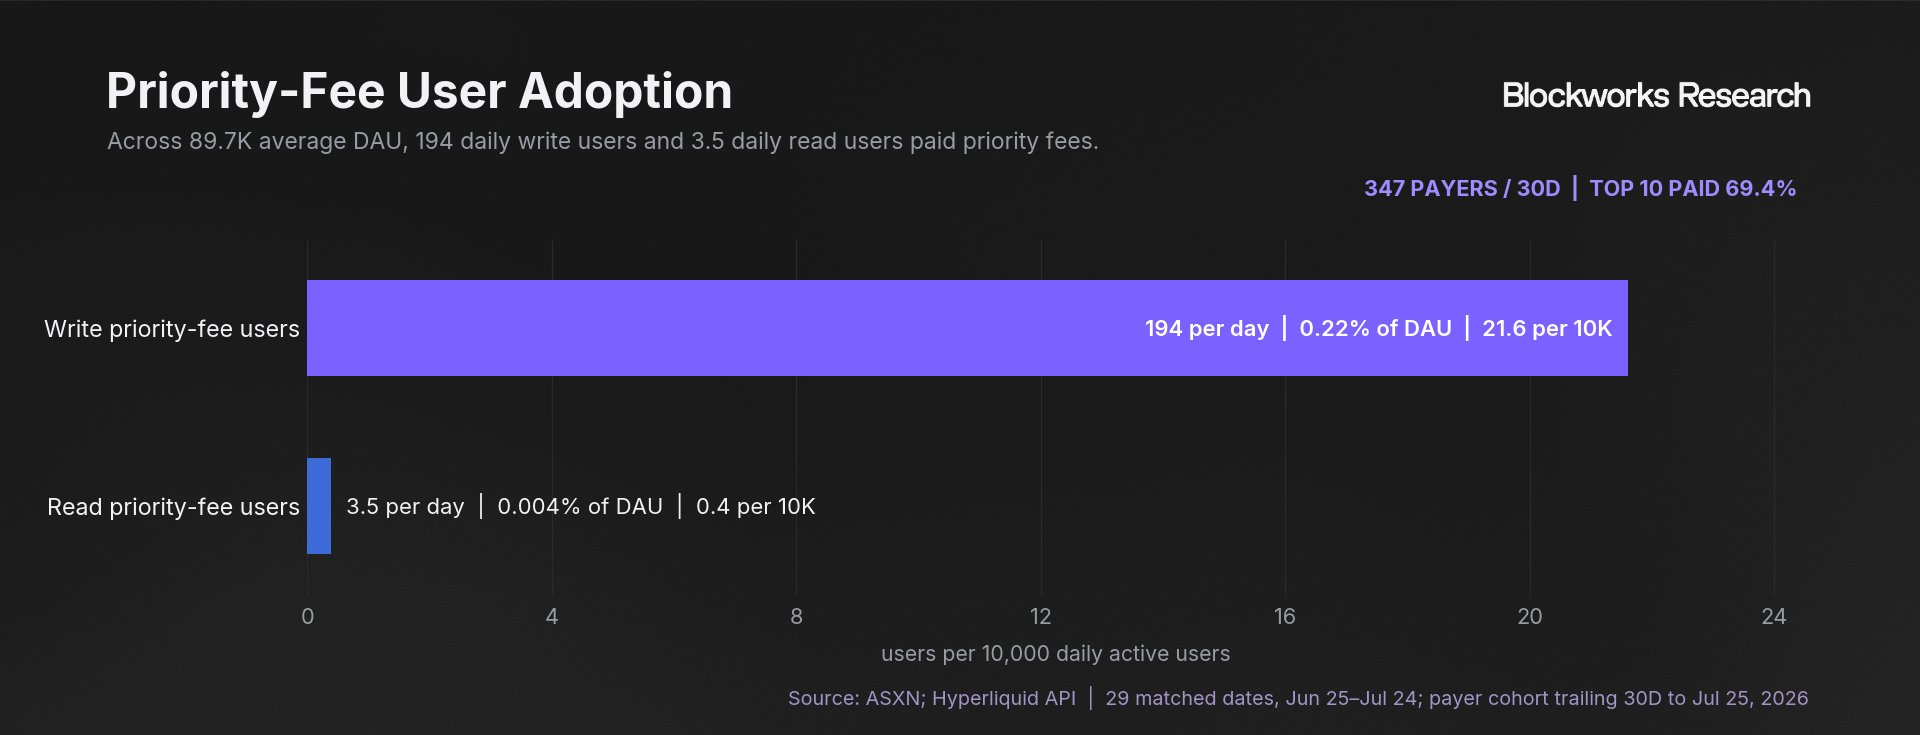
Despite the material revenue line, adoption across the trader base remains minimal. Over the latest 30 days, only 347 wallets paid priority fees, with the top 10 accounting for 69.4% of fees. Average daily participation was approximately 194 write-priority users and 3.5 read-priority users against 89.7K daily active users, or 0.22% and 0.004% of DAU respectively.
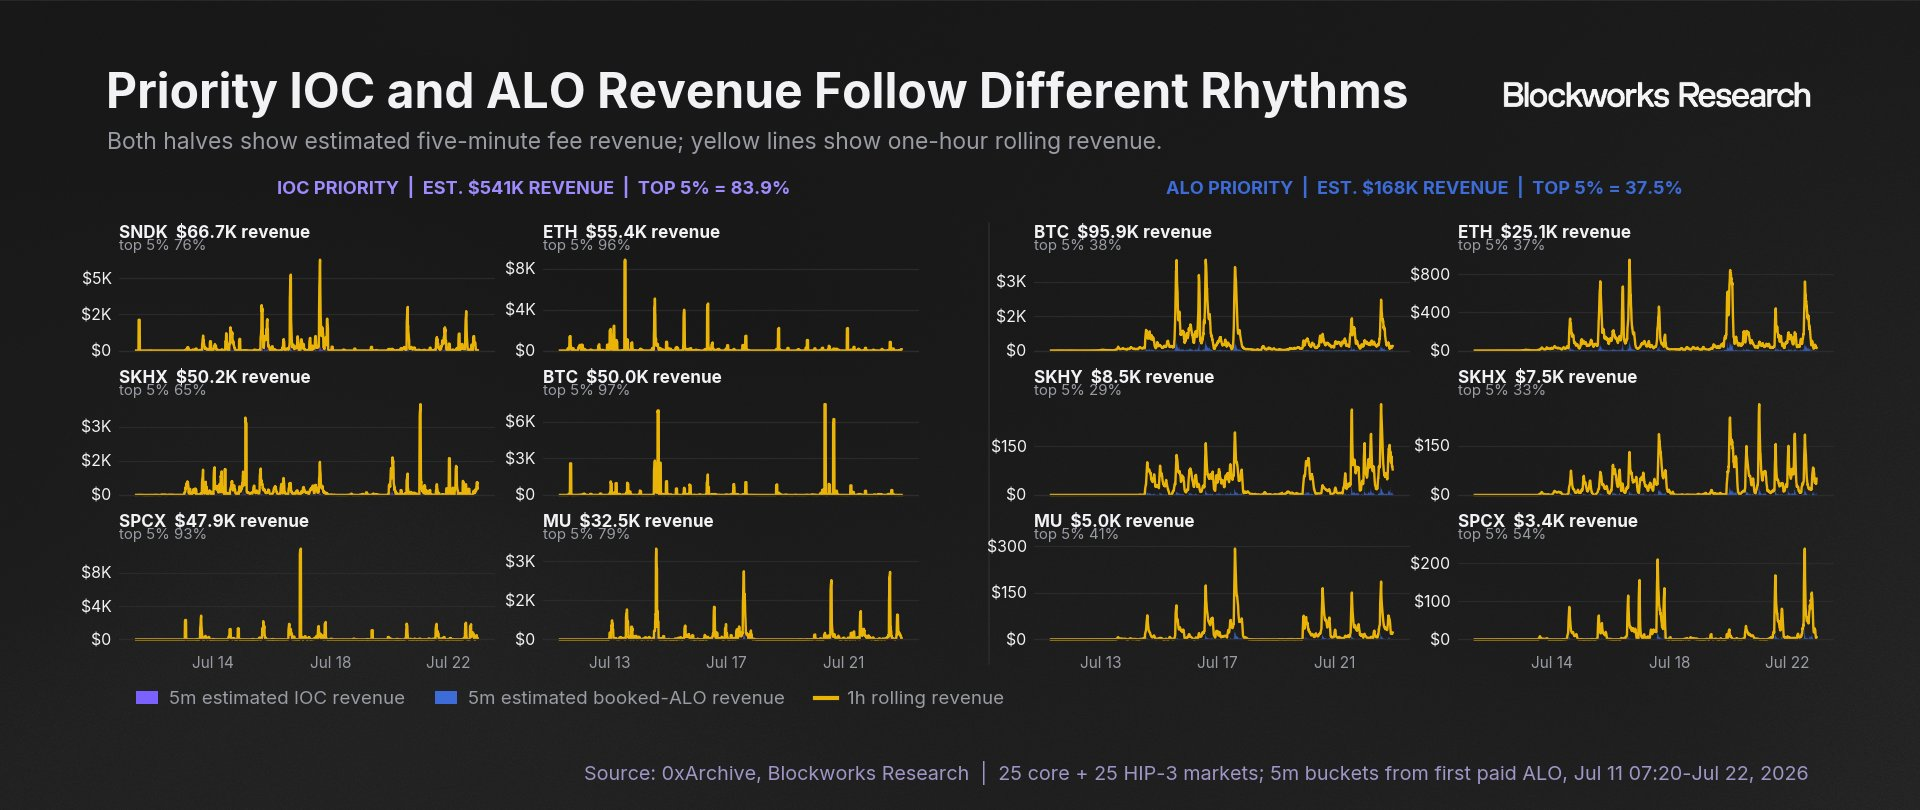
Usage is similarly concentrated in time. In the top fee-paying markets, the busiest 5% of five-minute windows contained 35.4% of priority IOC orders and 26.0% of booked ALOs. By fee value, the corresponding shares were 83.9% and 37.5%. Priority fees are still paid for discrete high-value opportunities rather than embedded as a routine execution cost across general flow.
Within the cohort that does pay, competition is already bidding away a large share of measured returns. Across the six highest-fee markets whose top three payers were delta-neutral over time, the IOC cohorts generated approximately $271K of visible gross returns, paid an estimated $187K in priority fees, and retained approximately $84K. Fees absorbed 69% of measured gross returns. The corresponding ALO cohorts generated $56K of visible gross returns, paid an estimated $78K in priority fees, and netted negative $22K after fees.
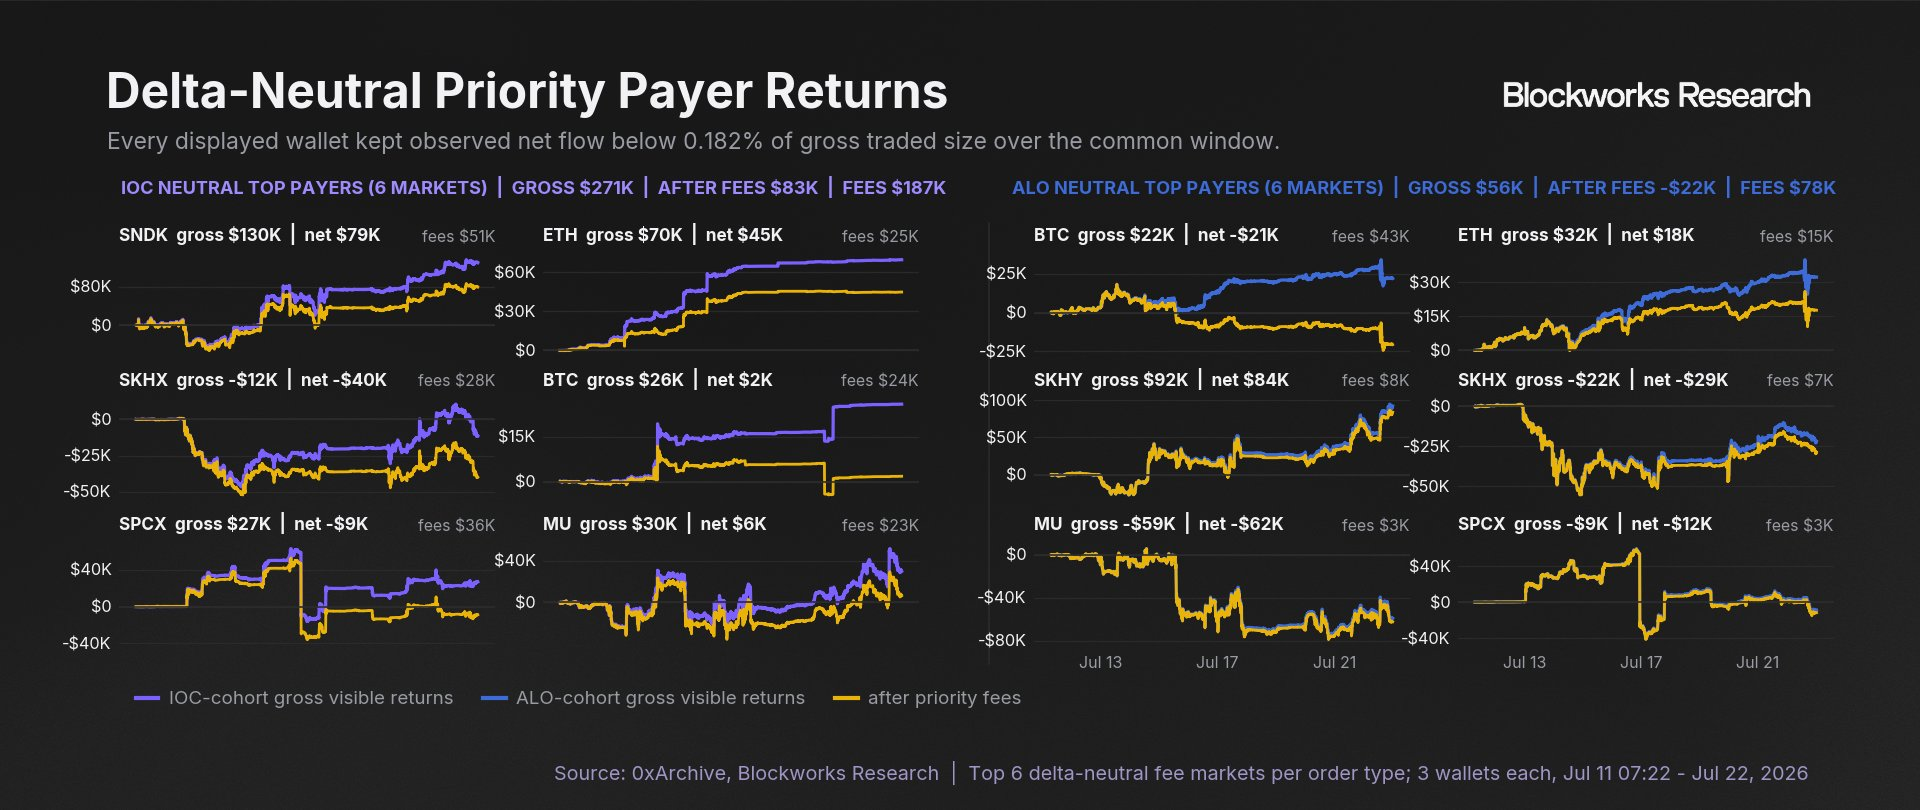
Priority fees are therefore still concentrated in discrete high-value opportunities, but in the examined cohorts they already capture a large share of measured gross edge.
Modeling Write Priority Fees
To estimate what these fees could become as adoption broadens and competition intensifies, we model how revenue scales as progressively more short-horizon edge is returned to the protocol.
We define taker and maker edge as the short-horizon opportunity set targeted by priority fees. We measure it using 30-second markouts, or a fill's gain or loss against the midpoint 30 seconds later. This captures temporary mispricings and stale liquidity that correct over short horizons. We include only fills from wallets with more than 100 fills and a positive weighted markout.
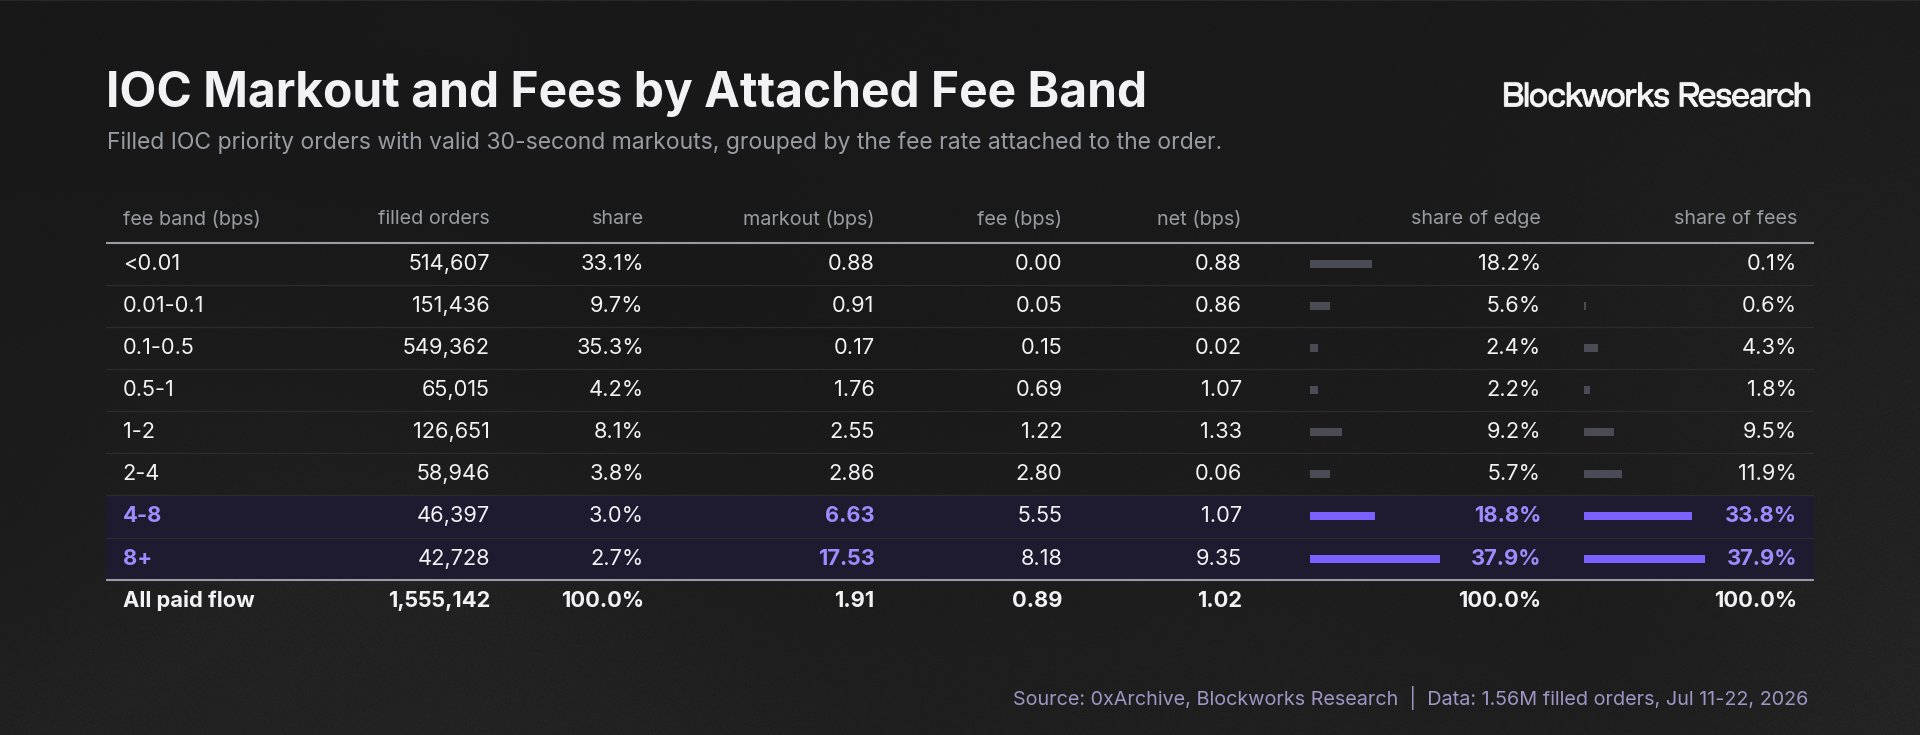
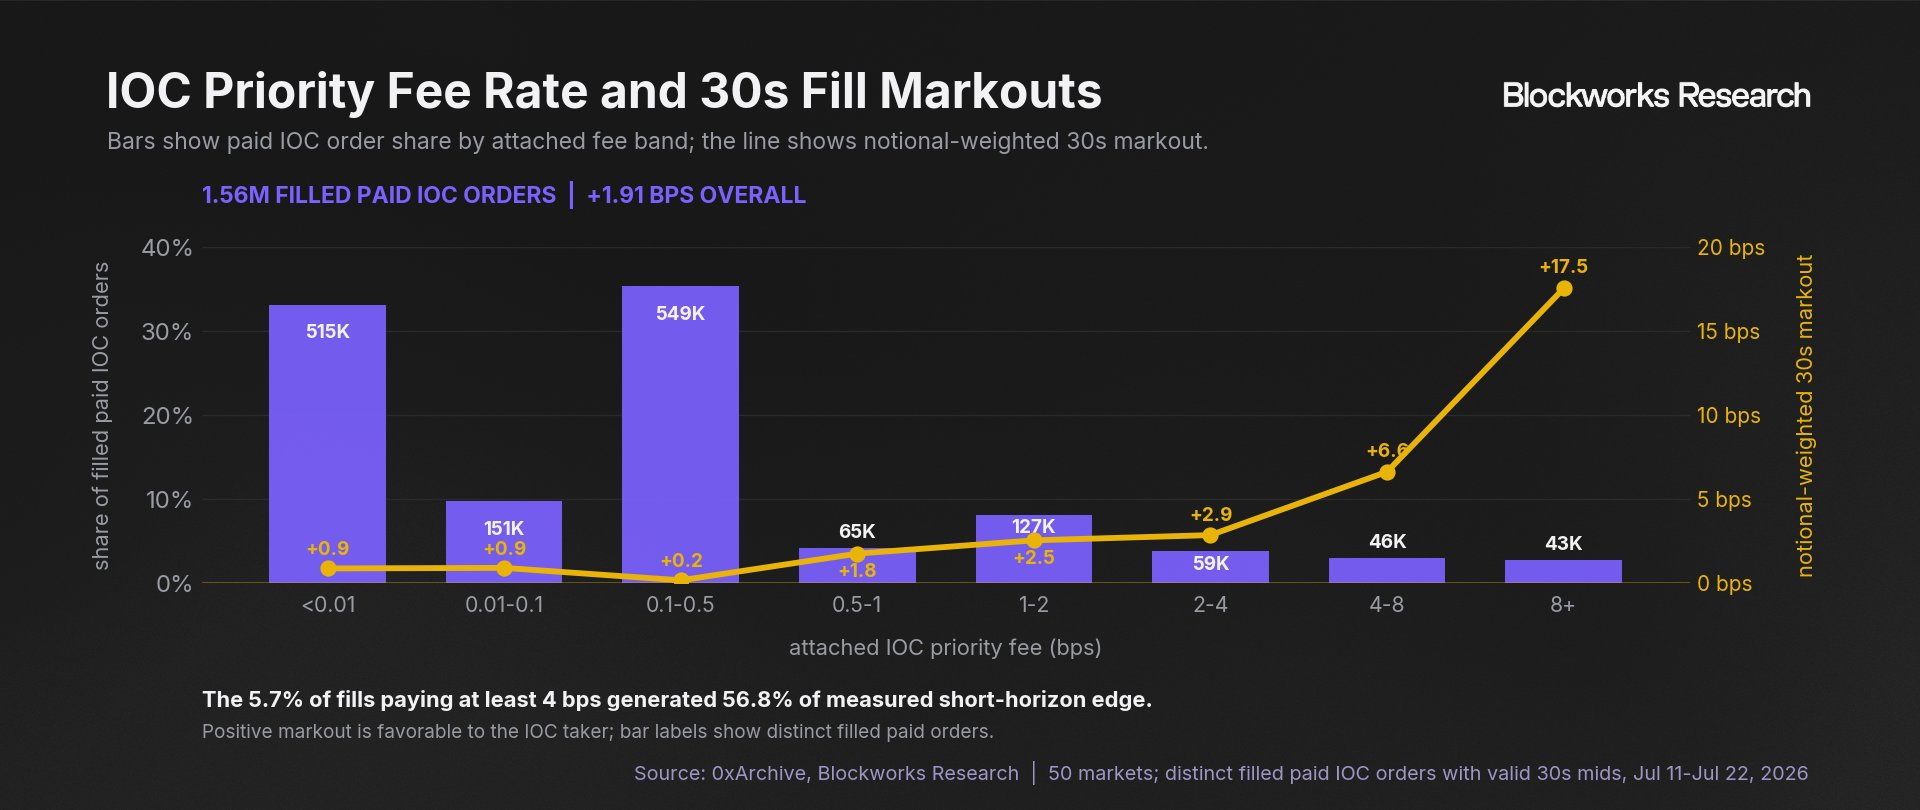
We test the framework against paid IOC flow. Across 1.56M fills with valid markouts, average markout rose with the attached fee, from 1.8 bps at 0.5 to 1 bp, to 6.6 bps at 4 to 8 bps, and 17.5 bps above 8 bps. The two highest fee bands held only 5.7% of paid fills but 56.8% of measured edge. Larger priority fees are therefore concentrated in trades with larger measured short-horizon edge.
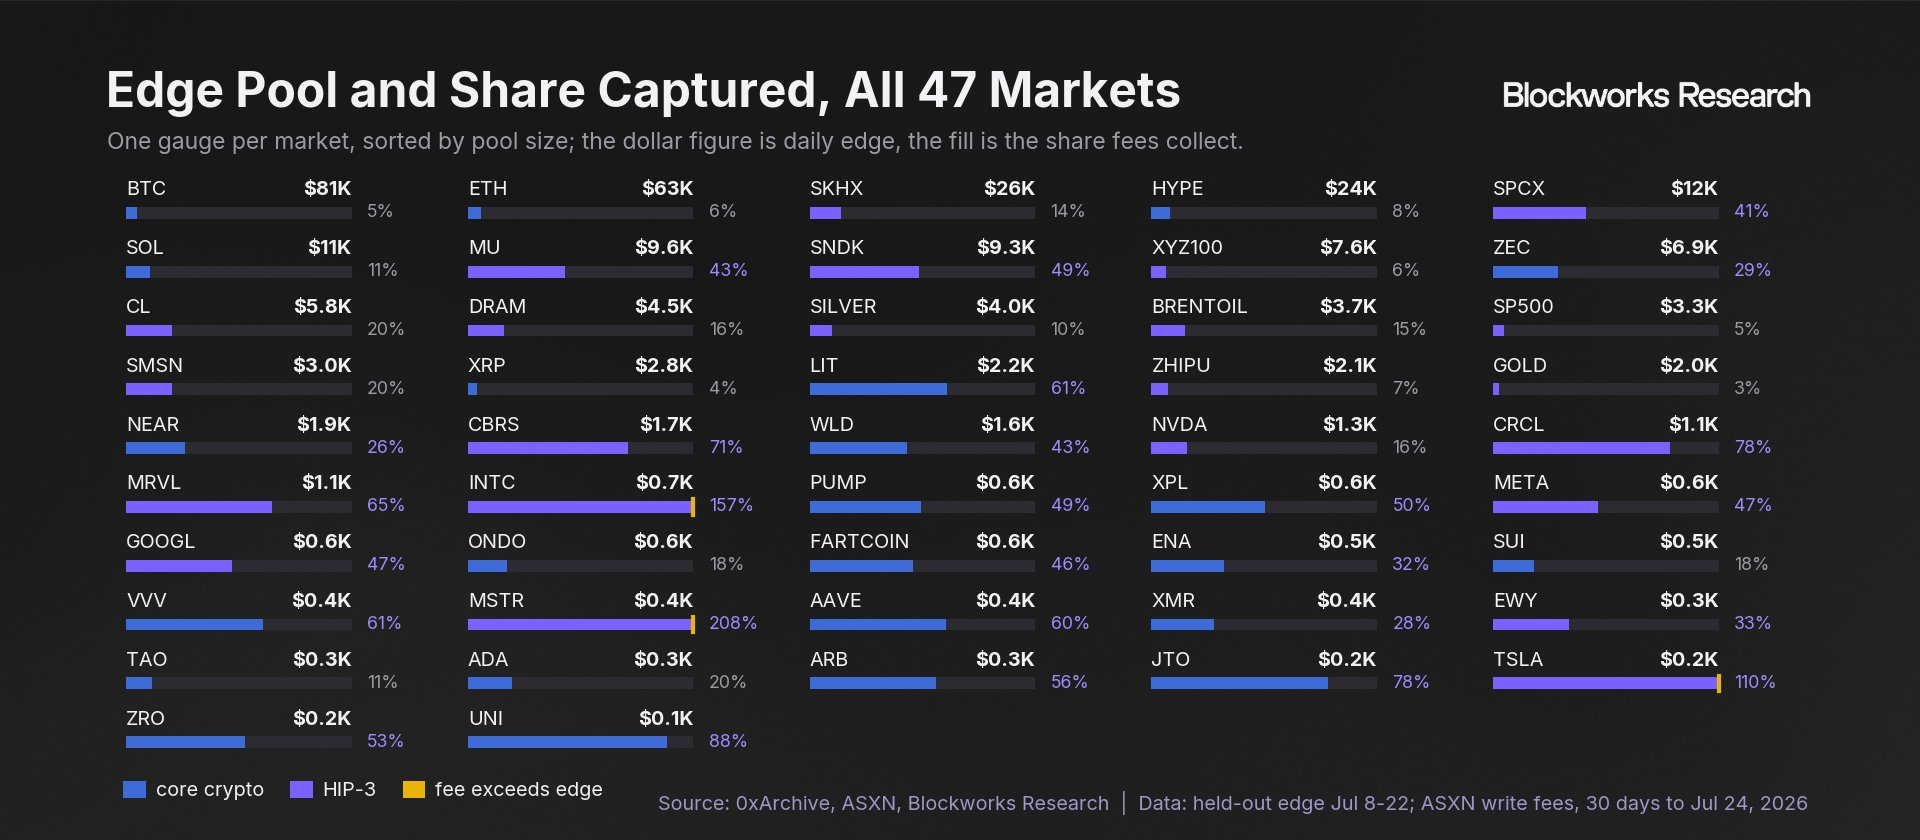
Overall, we estimate approximately $365K per day of observable short-horizon edge, or roughly $133M annualized. IOC edge totals $301K per day, with BTC and ETH contributing $145K, nearly half the pool. ALO maker edge is smaller at $64K per day, with HIP-3 markets generating 81% of it. Against this pool, priority fees currently internalize $60.6K per day, equal to 15% of measured IOC edge and 22% of measured ALO edge, or a $22.1M annualized run rate.
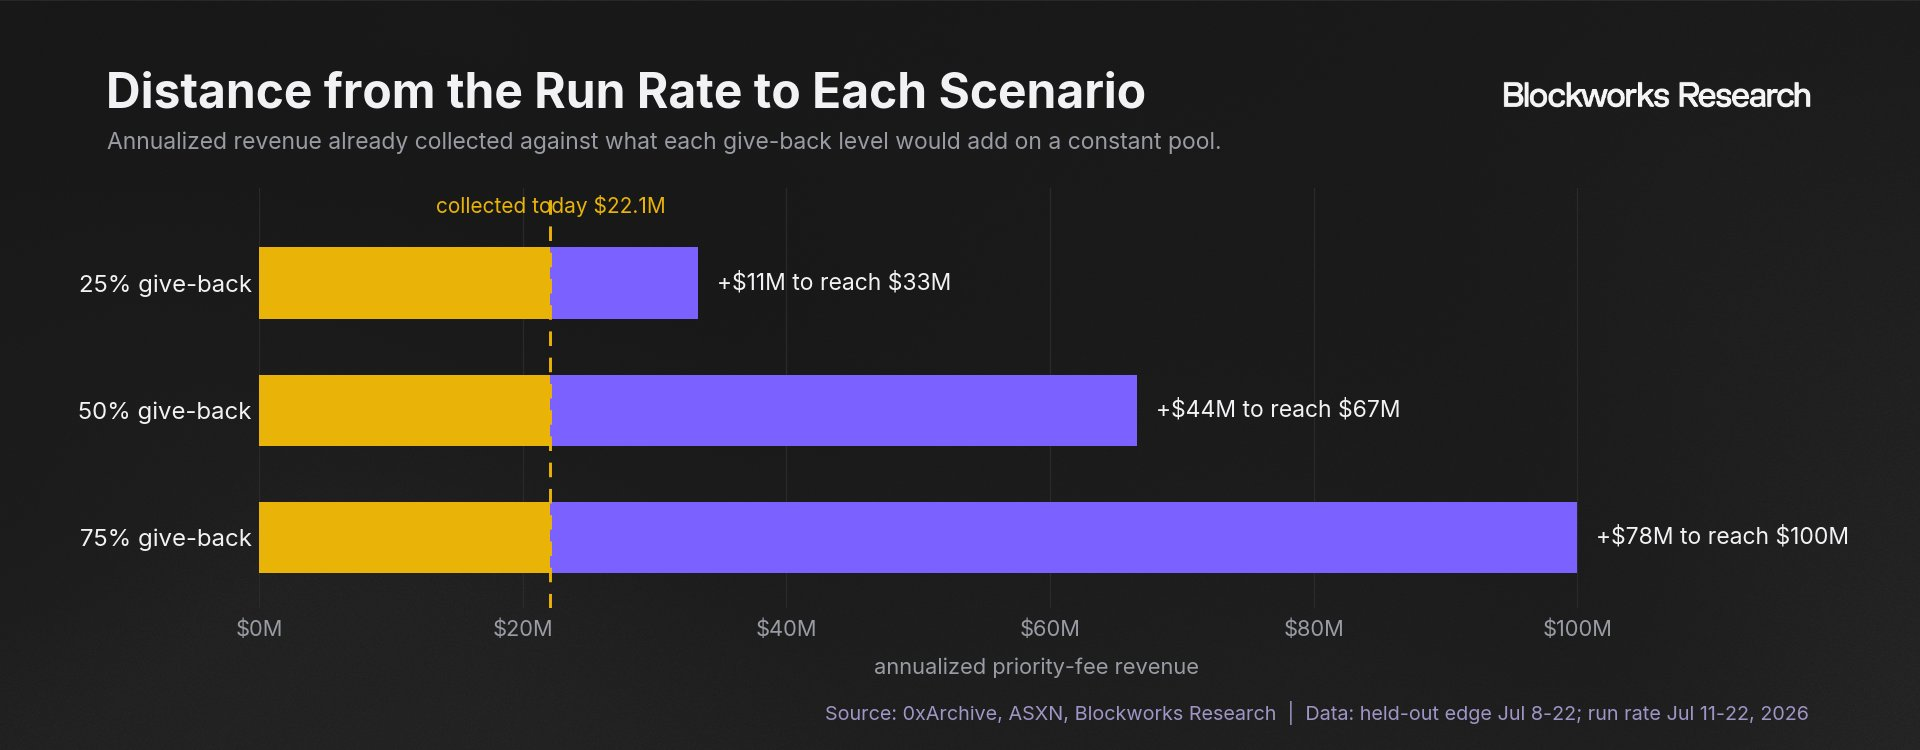
Holding the current edge pool constant, a 25% capture rate supports approximately $33M of annualized write-priority revenue, a 50% capture rate supports $67M, and a 75% capture rate supports $100M. These scenarios isolate changes in fee capture and do not assume growth in the underlying opportunity set, since edge added by new markets is likely offset by edge lost as existing markets become more efficient.
Modeling Read Priority Fees
Read priority is harder to model because revenue depends on both the expected value of a seat and the number of seats Hyperliquid makes available. Still, two observations are visible in the current data.
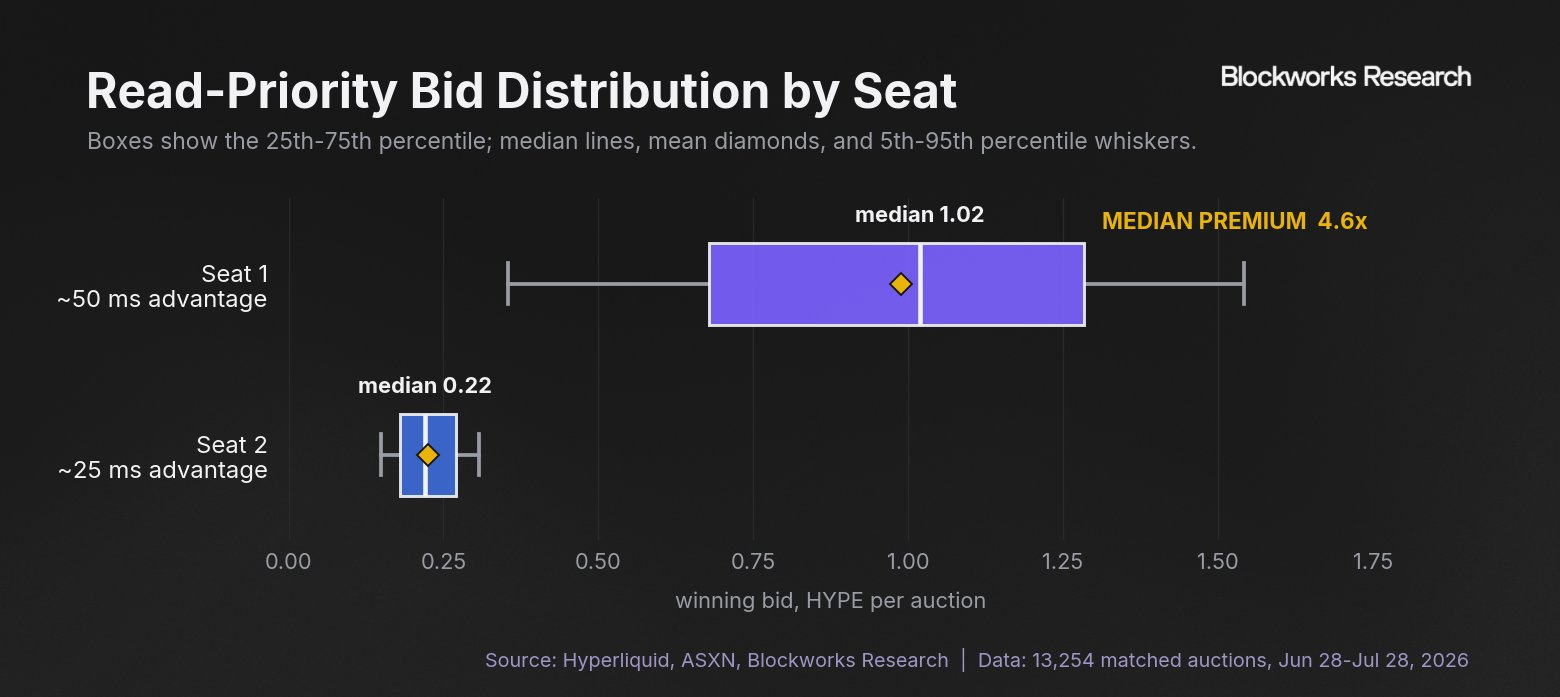
First, supply is deliberately narrow. Two independent priority slots exist, with an observed latency difference of approximately 25 ms between levels. The average winning bid over the latest 30 days was 0.61 HYPE, six times the 0.1 HYPE floor. The two seats generated $1.08M over the period, equivalent to a $13.1M annualized run rate, or roughly $6.6M per seat.
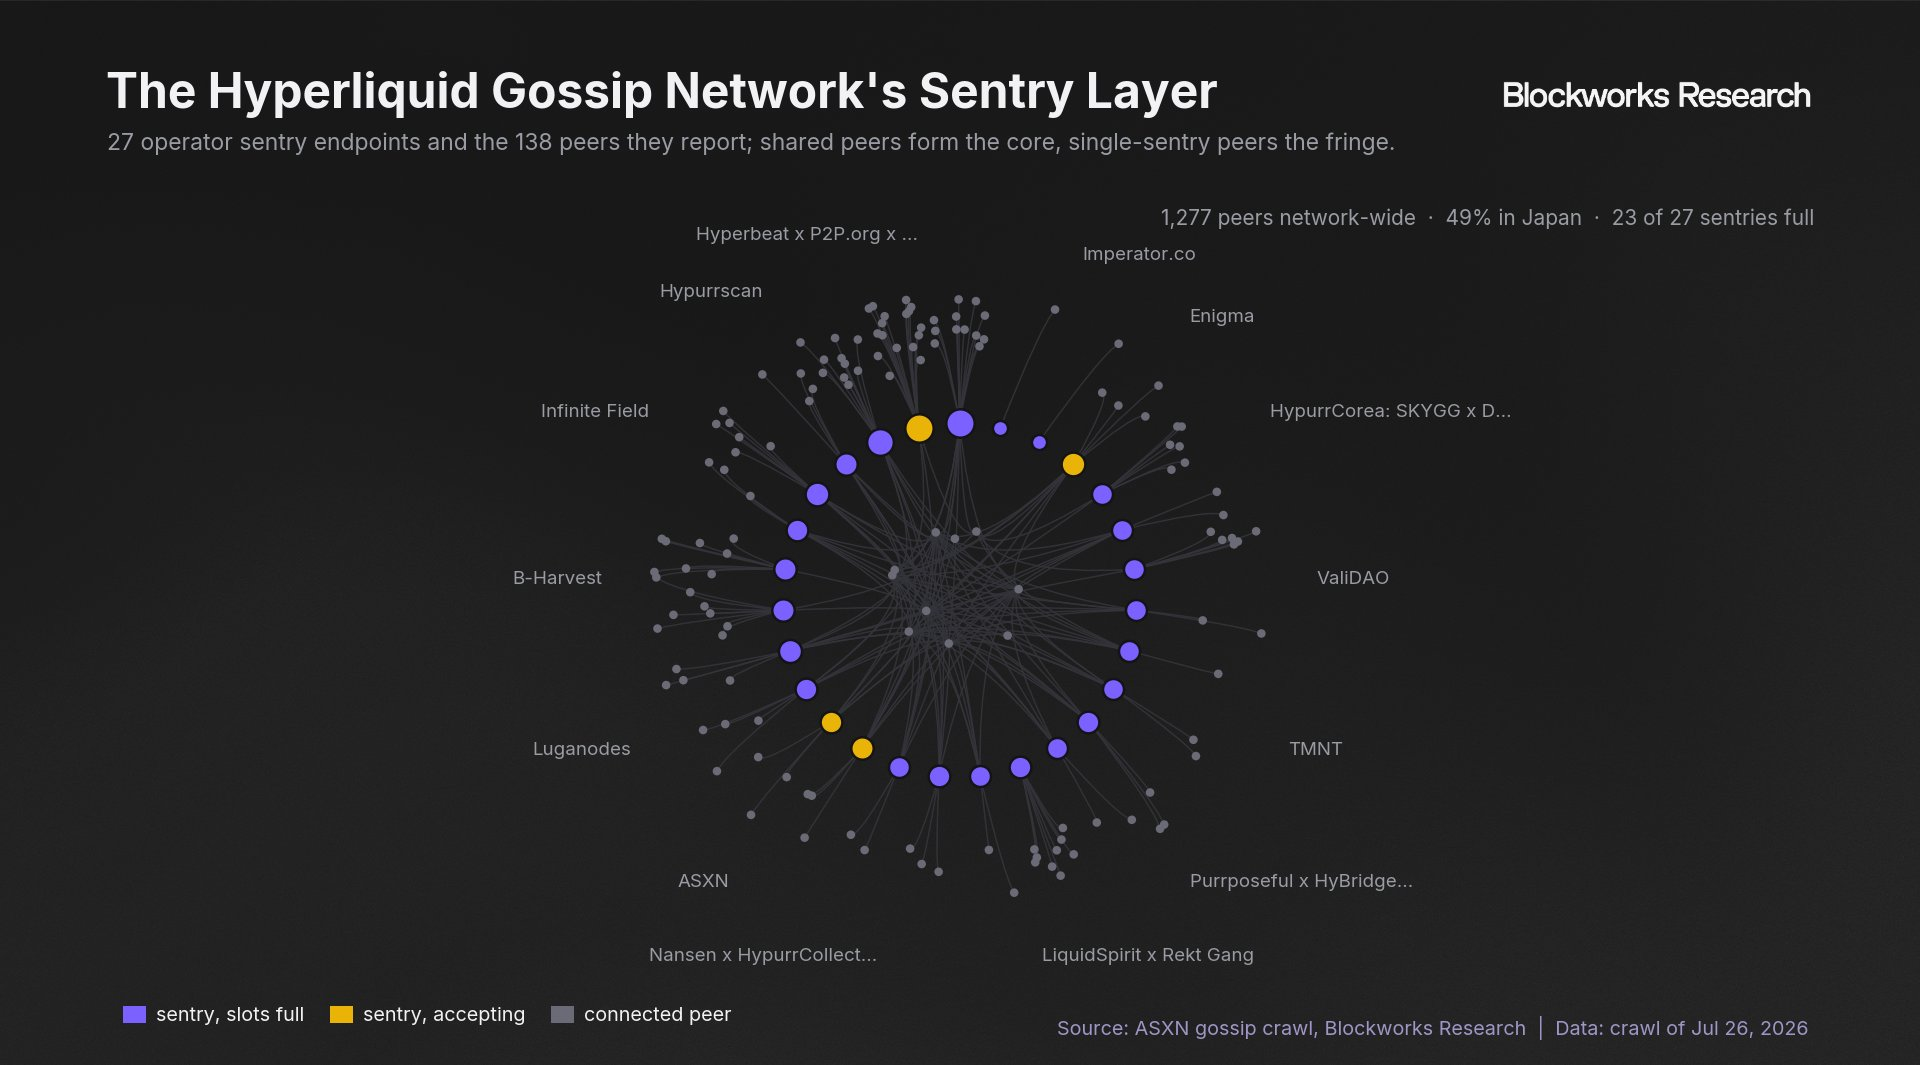
Second, the free alternative is saturated. The public gossip network, which carries no priority advantage, already holds roughly 1,300 peers. Of the 27 operator sentry endpoints that anchor it, 23 are full and rejecting new connections.
The combination of high paid-seat revenue and constrained free access supports an expansion in seat supply.
To model expansion, we anchor to the current average winning bid of 0.61 HYPE and assume average seat prices decline as supply grows. The seats are distinct: the higher-priority seat has cleared at a median price 4.8× that of the lower-priority seat, and future expansion would likely introduce additional latency tiers. However, to avoid layering several uncertain assumptions, we model the seat set using the average price of the two existing seats rather than separate demand curves for each tier.
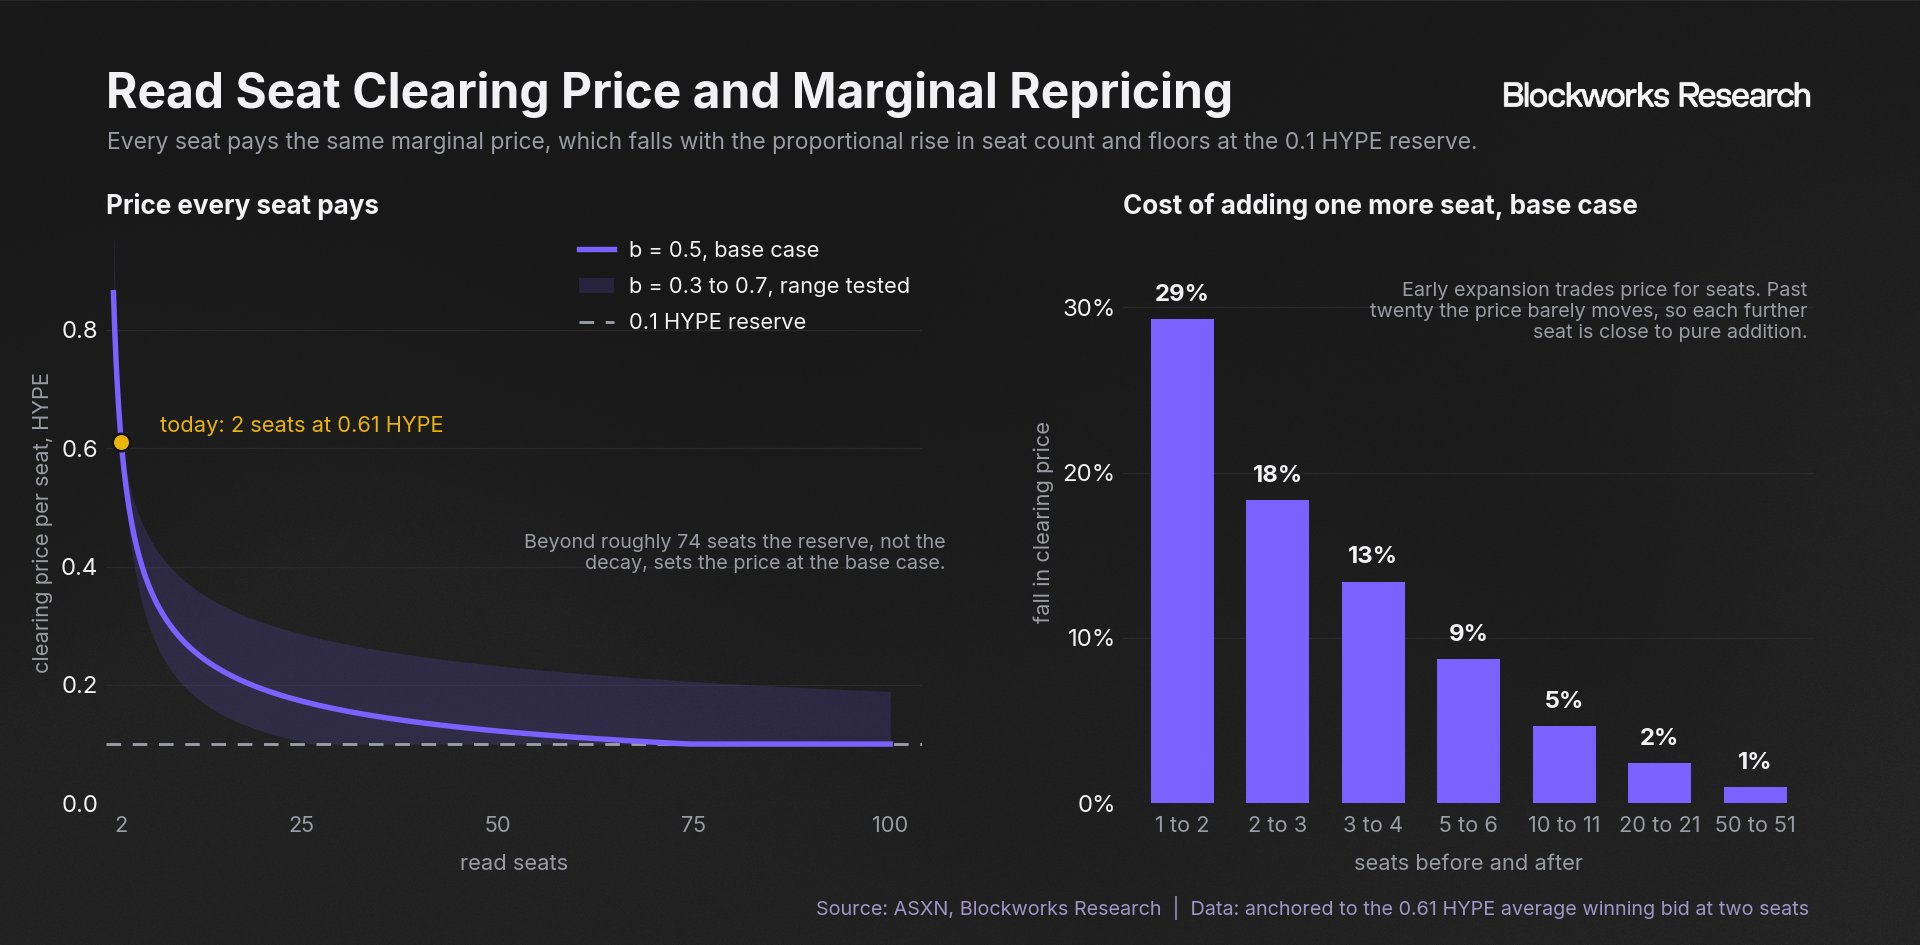
Because added seats reduce both the value of the latency advantage and the competitiveness of each auction, our model applies a demand curve to the average clearing price across the expanded seat set.
We use an elasticity of 0.5 in the base case, under which total revenue scales with the square root of seat count, and test a range of 0.3 to 0.7. The model also imposes the 0.1 HYPE reserve. Under the base case, moving from one seat to two reduces the modeled average price by 29%, while moving from 20 seats to 21 reduces it by approximately 2%.
Our mid-term assumption is an expansion to 5 to 25 seats, supporting $21M to $48M of annual read-priority revenue against $13.1M today. Over the longer term, as volume and asset diversity grow, expansion toward 50 to 100 seats supports $68M to $111M and makes read priority a material revenue line in its own right.
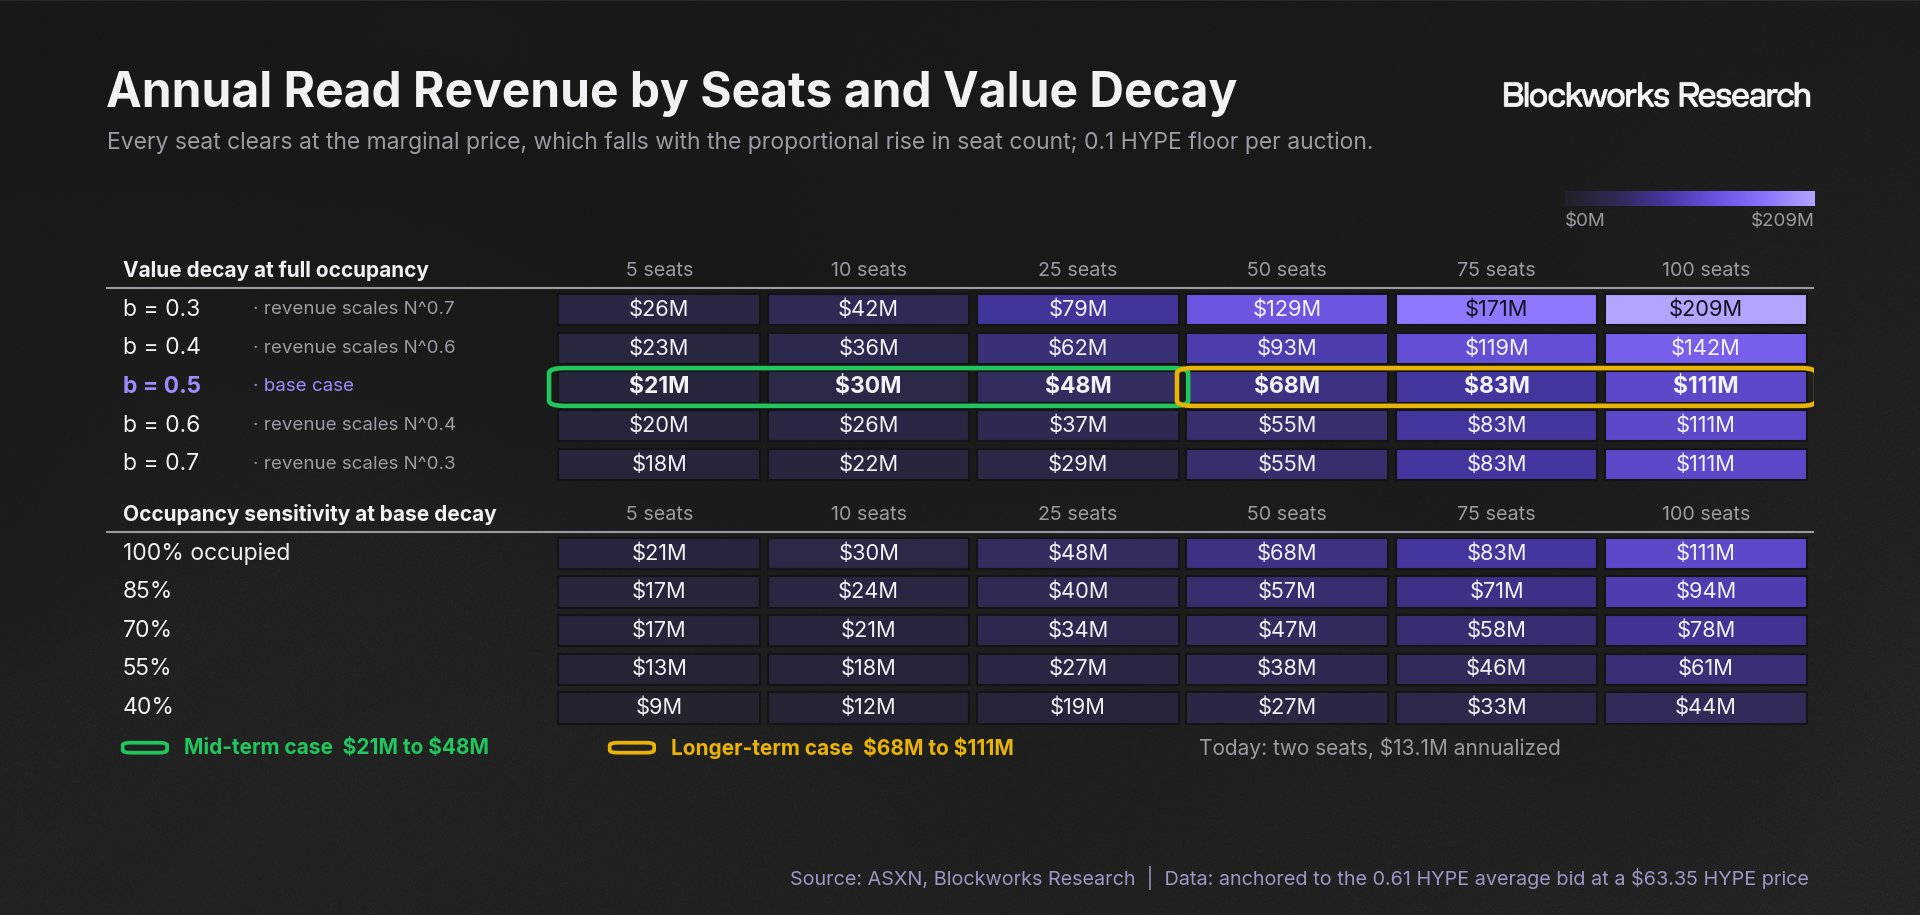
We attach lower confidence to these estimates than to the write-priority scenarios, which anchor to a measured edge pool. The principal risks are that Hyperliquid redesigns the mechanism or that current bidders are unrepresentative of marginal demand, causing average clearing prices to fall faster than assumed. The current data nevertheless support some expansion: each seat currently generates roughly $6.6M annually, 23 of 27 free sentry endpoints are full, and additional supply could still clear above the reserve. Expansion would also be consistent with Hyperliquid's history of introducing mechanisms at small scale and widening them once demand is demonstrated.
Modeling Priority Fees
Read and write priority fees already contribute materially to revenue while demonstrated usage remains early, leaving substantial room for adoption-led growth.
Under our modeled case, Hyperliquid's annualized revenue run rate nearly doubles, from $498M in July to $979M by December 2026. Roughly a fifth of the December figure, $205M annualized, is USDC reserve yield, which begins accruing on August 26. Priority-fee revenue grows from $32M to $87M, moving from 6.4% to 8.9% of total revenue, or 11.3% of revenue excluding the yield.
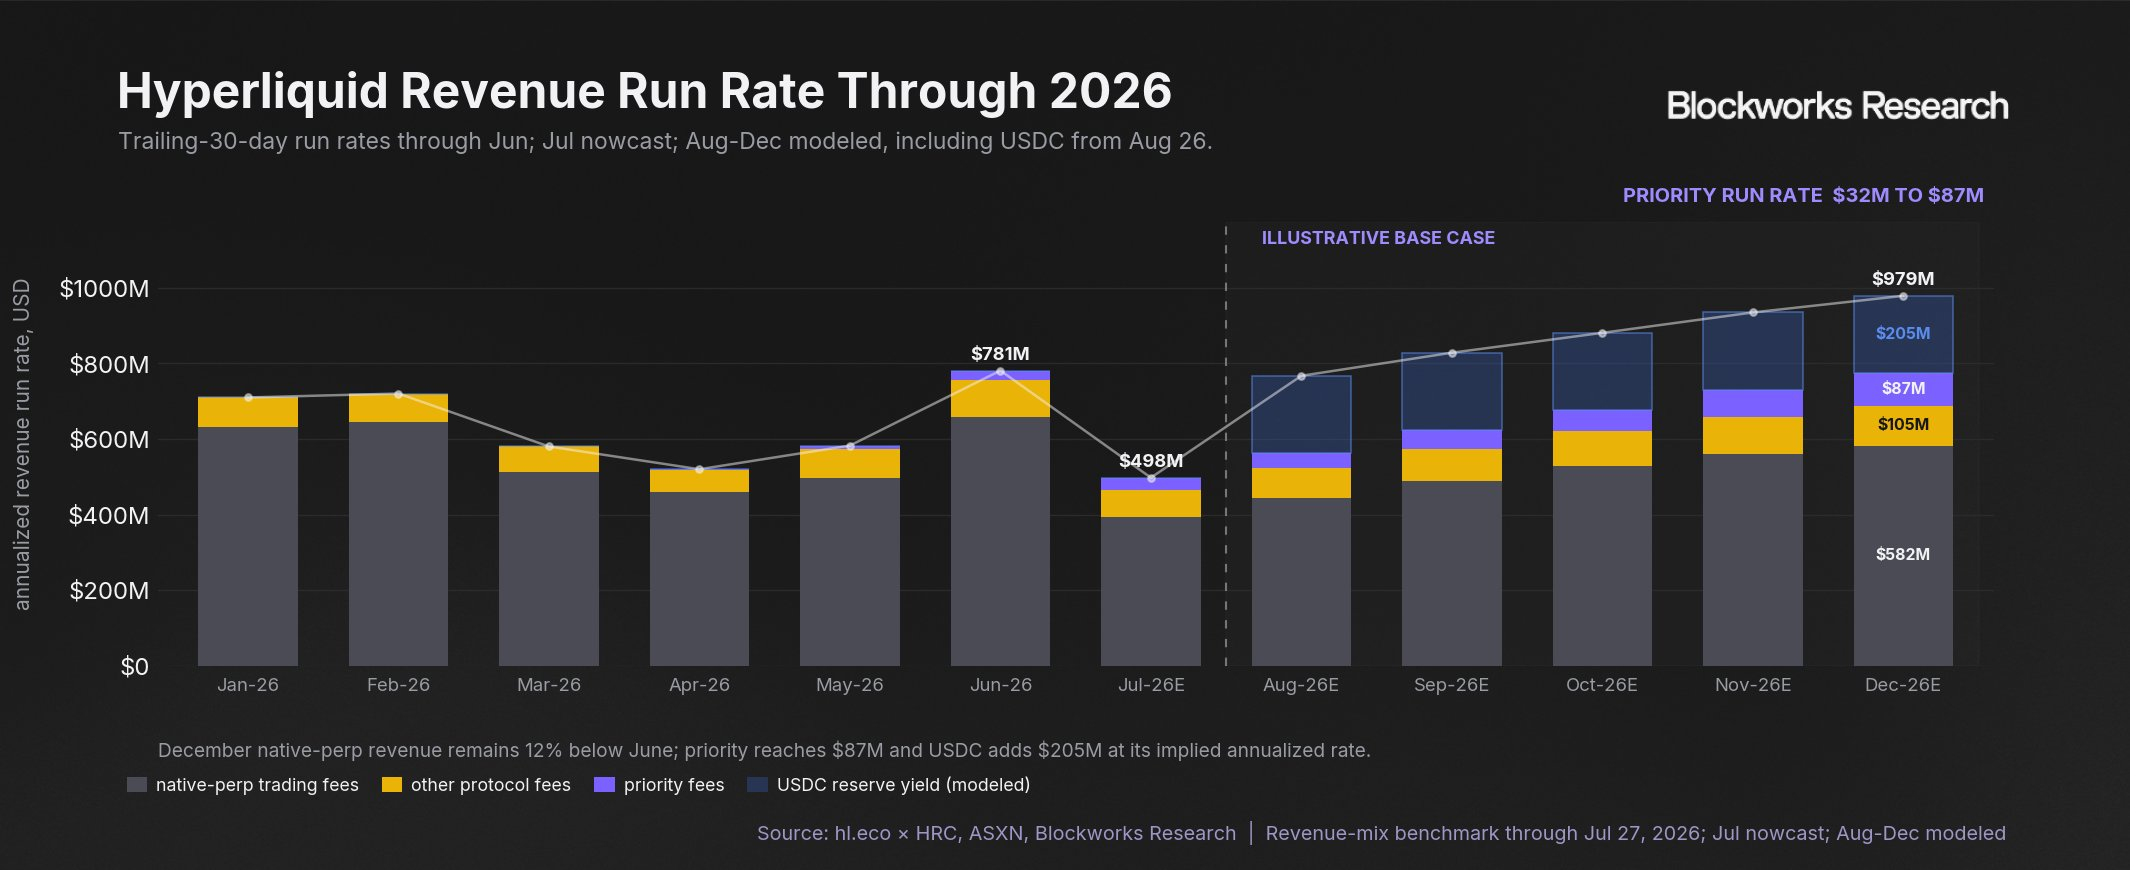
Within priority fees, write-side capture drives the expansion. We hold the measured edge pool constant at $133M annualized and let capture rise from 14% to 50%, taking write-priority revenue from $19M to $67M. To keep the model from overweighting read fees, which are less certain, we anchor expansion at five seats only, moving read-priority revenue from $13M to $21M. Additionally, the broader model assumes native-perp revenue recovers from a $394M July run rate to $582M in December, approximately 12% below its June level, and HIP-3 revenue compounds at 8% per month. Spot, HyperEVM gas, and auction revenue are modeled separately on the same recovery profile as native perps.
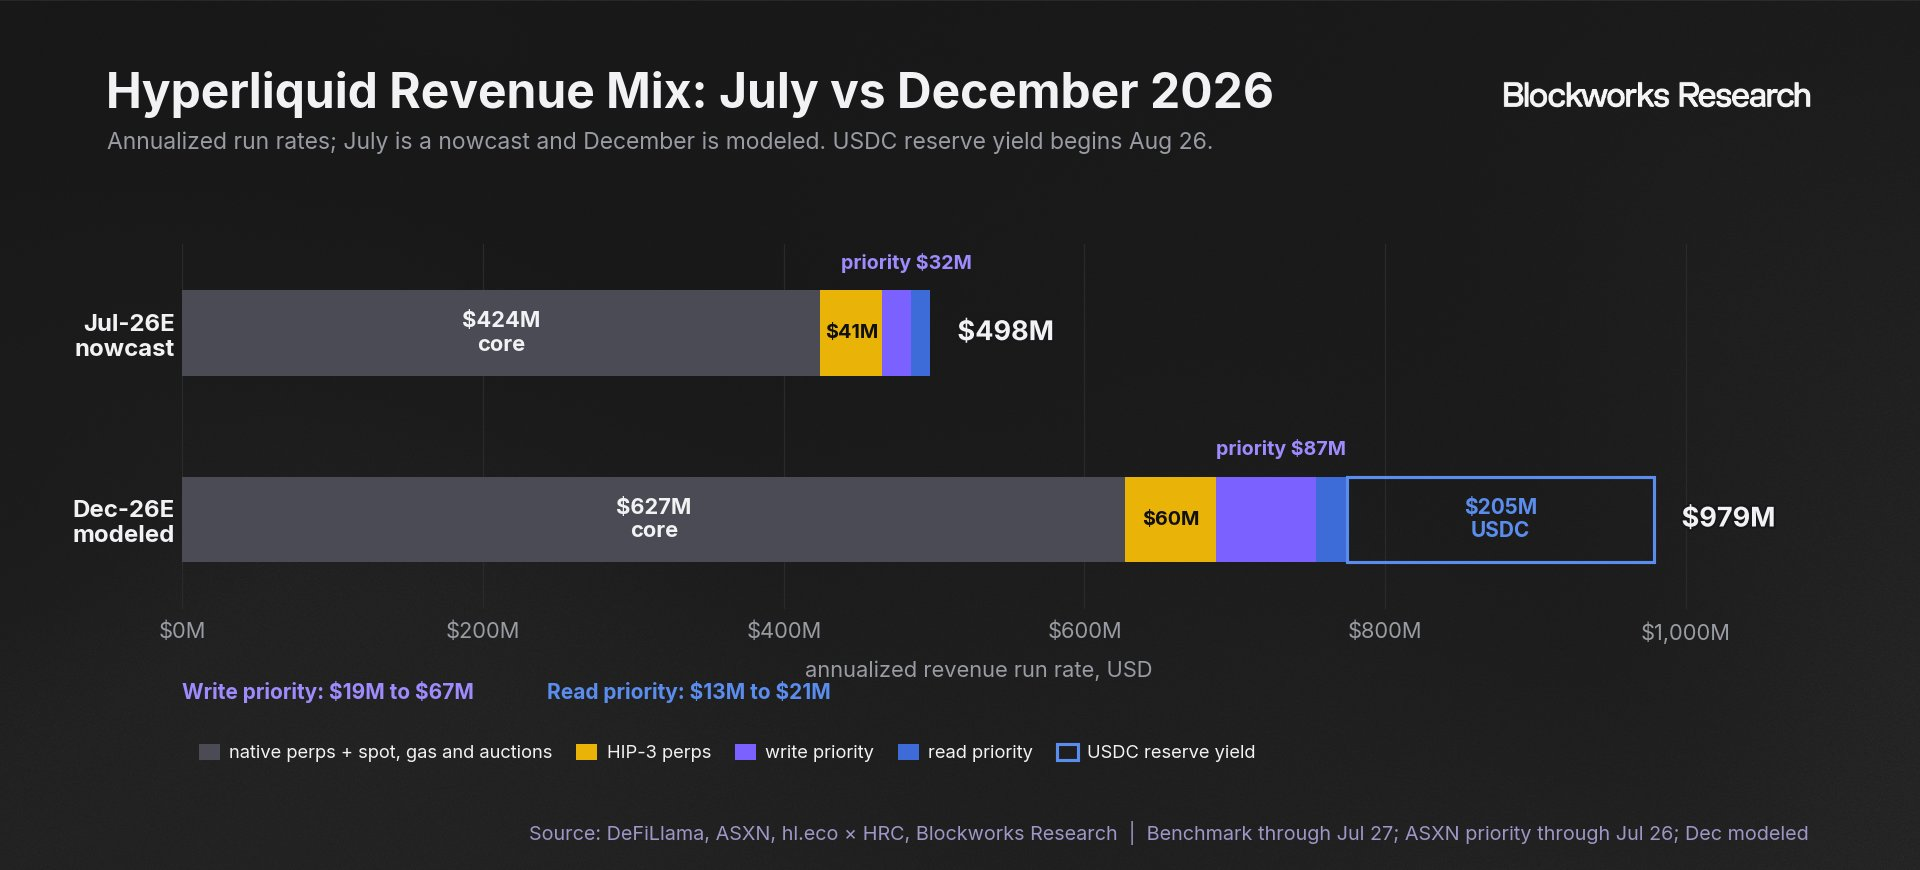
Hyperliquid still remains structurally dependent on cyclical core trading volumes, which remain by far its biggest line item even after the modeled growth. However, the key trend across these developments is decreasing that reliance, diversifying into a more stable base anchored by yield payments, HIP-3, and priority fees on these markets.
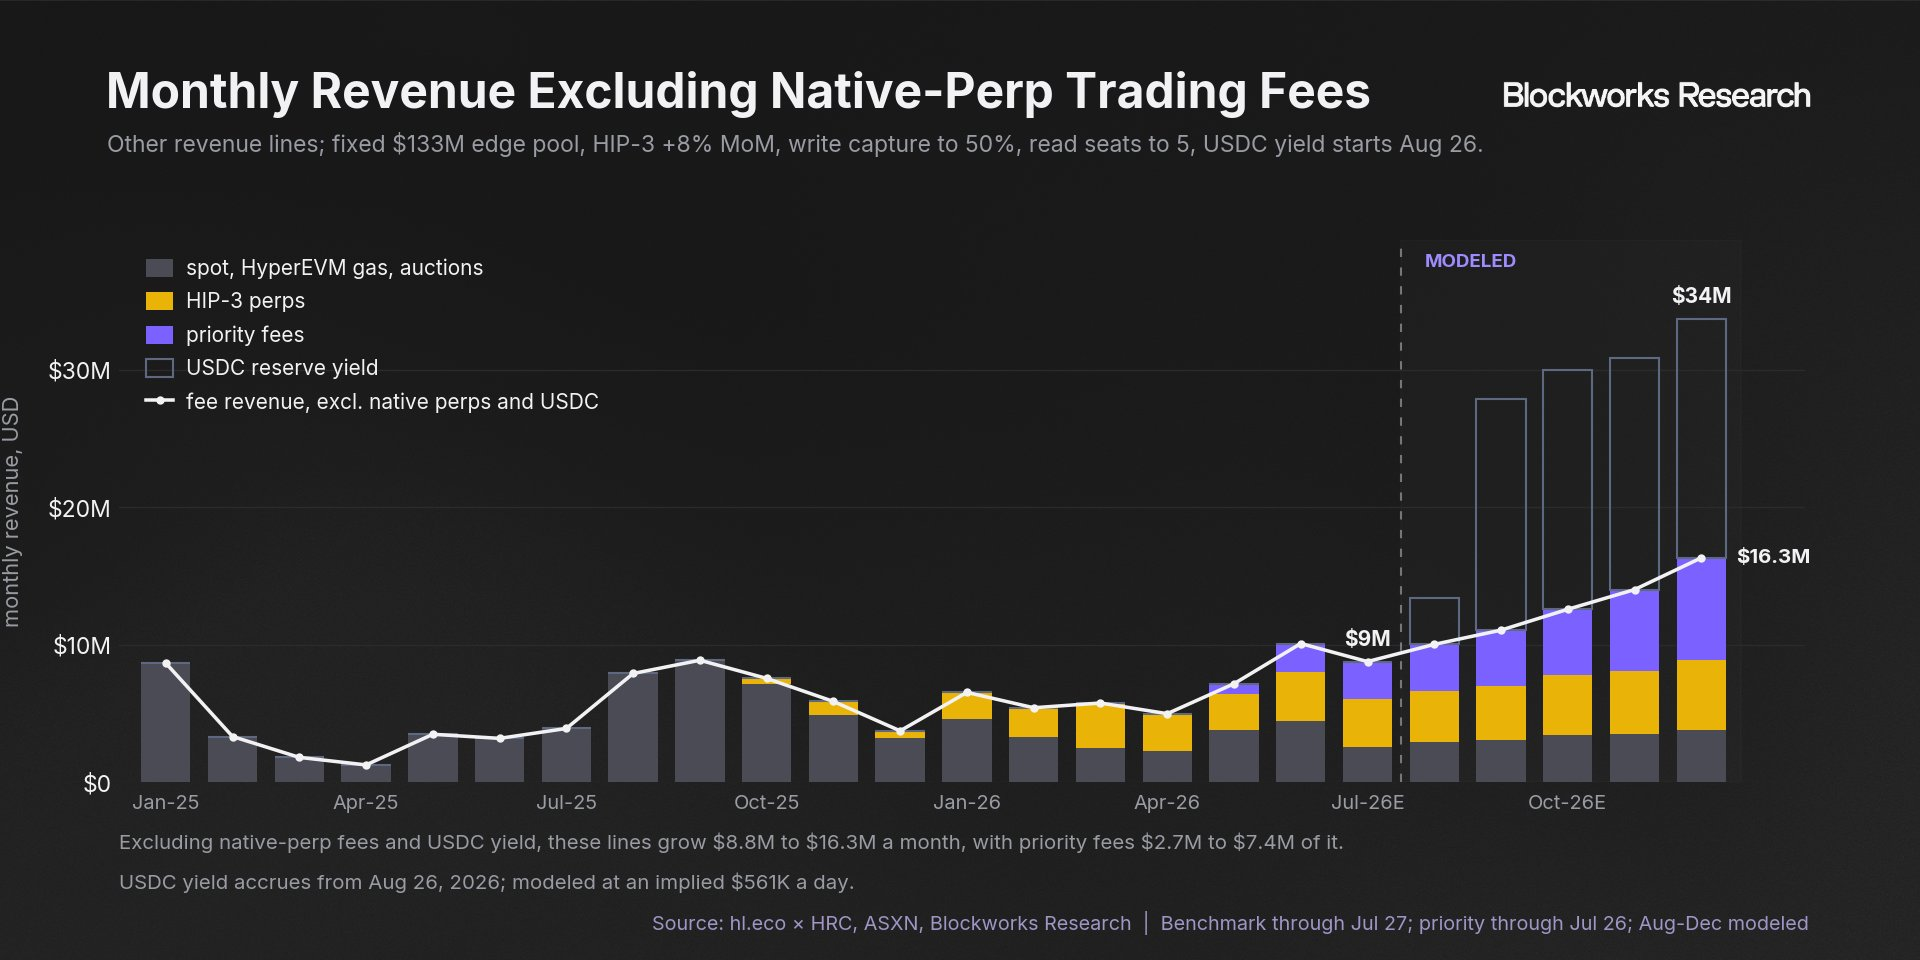
Monthly revenue from these non-core lines nearly quadruples, from approximately $8.8M in July to $33.7M by December: $17.4M from USDC reserve yield, $7.4M from priority fees, $5.1M from HIP-3, and $3.8M from spot, HyperEVM gas, auctions, and other lines.
Conclusion
Hyperliquid has successfully expanded beyond core crypto perps, with HIP-3 activity led by TradeXYZ becoming a meaningful contributor to platform volume. That expansion has been strategically important, but it has not translated one-for-one into revenue. HIP-3 markets carry lower fees and split trading revenue with deployers, leaving a question around how effectively the new activity can be monetized.
Priority fees address part of that gap. They allow Hyperliquid to internalize short-horizon edge created by latency-sensitive trading across both crypto and RWA markets. Competition remains limited within protected action classes, allowing traders to bid for queue position and faster execution without changing the underlying market structure. Adoption remains limited and concentrated, yet the examined users already return a large share of measured gross edge to the protocol. Under our modeled case, priority-fee revenue rises from a $32M annualized run rate in July to $87M by December, reaching 8.9% of total revenue.
Hyperliquid will remain primarily a crypto platform in the near term. Core perps still offer higher monetization, full protocol ownership of fees, and the deepest integrated trader base. However, HIP-3, priority fees, and the USDC fee share provide credible revenue levers outside core crypto. Together, they diversify Hyperliquid's revenue mix, reduce its dependence on cyclical crypto volume, and improve the economics of its expansion into traditional assets.
The information contained in this report and by Blockworks Inc. and related affiliates is for general informational purposes only and is not intended to provide legal, financial, or investment advice. The report should not be construed as an offer or solicitation to buy or sell any security, token, or financial instrument and does not represent any recommendation or endorsement of any investment or financial product or service. Blockworks Inc. and related affiliates are not registered as a securities broker-dealer or an investment advisor in any jurisdiction or country.