
Hyperliquid lists hundreds of perps and you watch three of them. 0xArchive's new breadth endpoint answers one question, every minute: how much of the market is actually winning right now. 100 means every coin is above the day's average price. 0 means the whole board is under water. Here is what it measures, its first week, and three things to know before you trade on it.
Watching one price when Hyperliquid trades hundreds of perps
BTC is up half a percent, so the market is fine. On Hyperliquid that read fails daily. The tape is hundreds of coins, and the majors can hold steady while everything else bleeds.
Checking used to mean flipping through hundreds of charts. Now it is one request. Every minute, 0xArchive counts every coin on the venue and writes down how many are winning. The full history is saved.
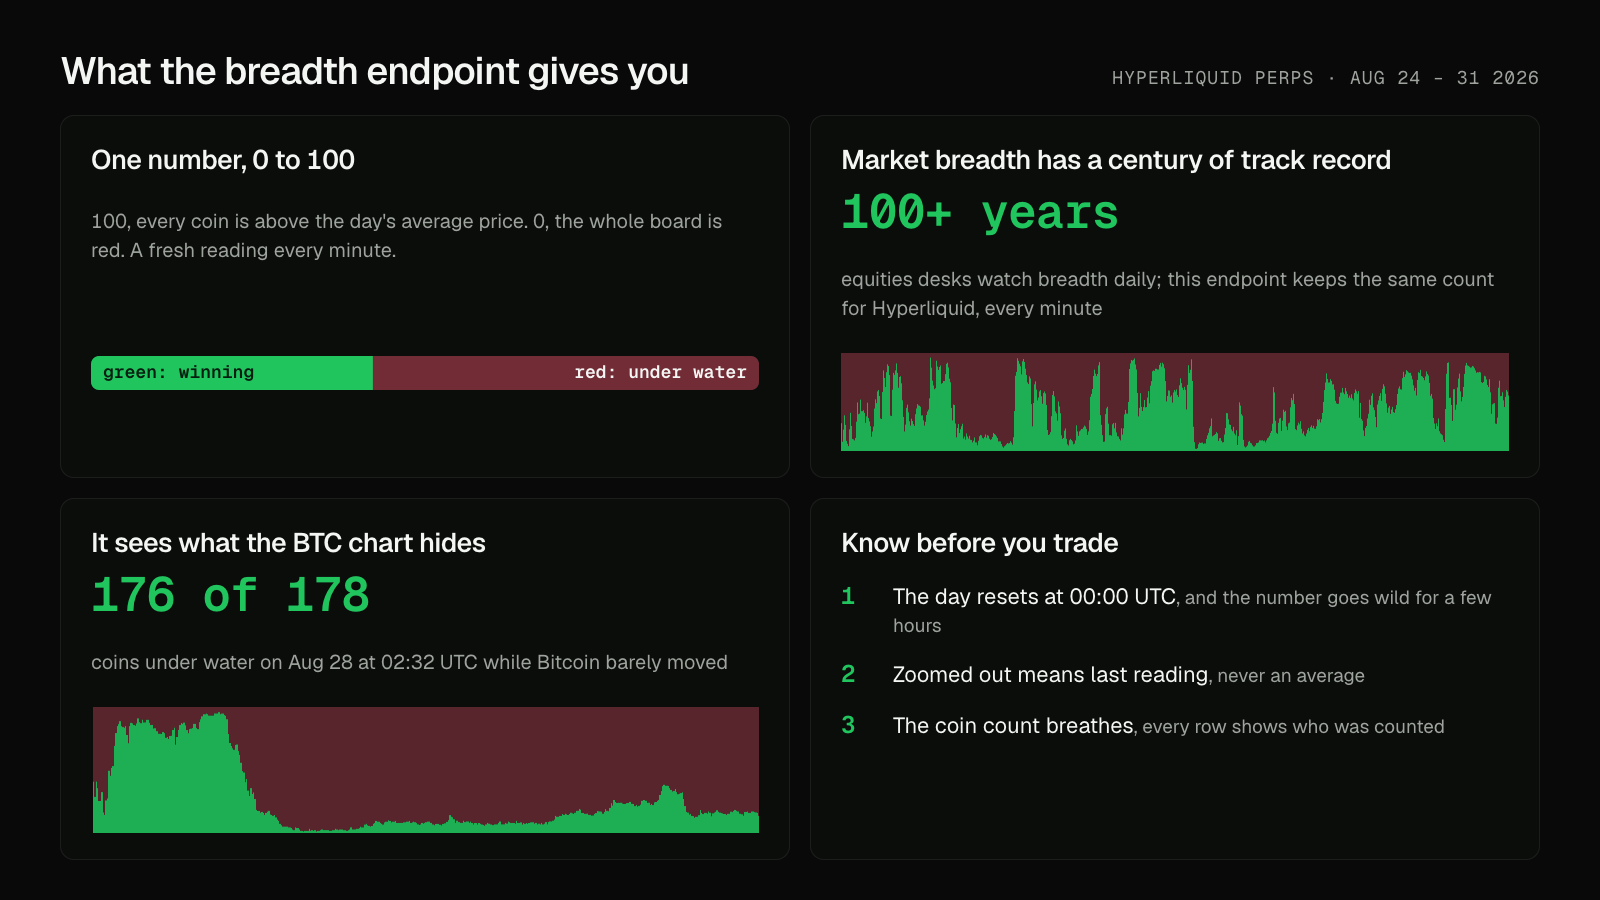
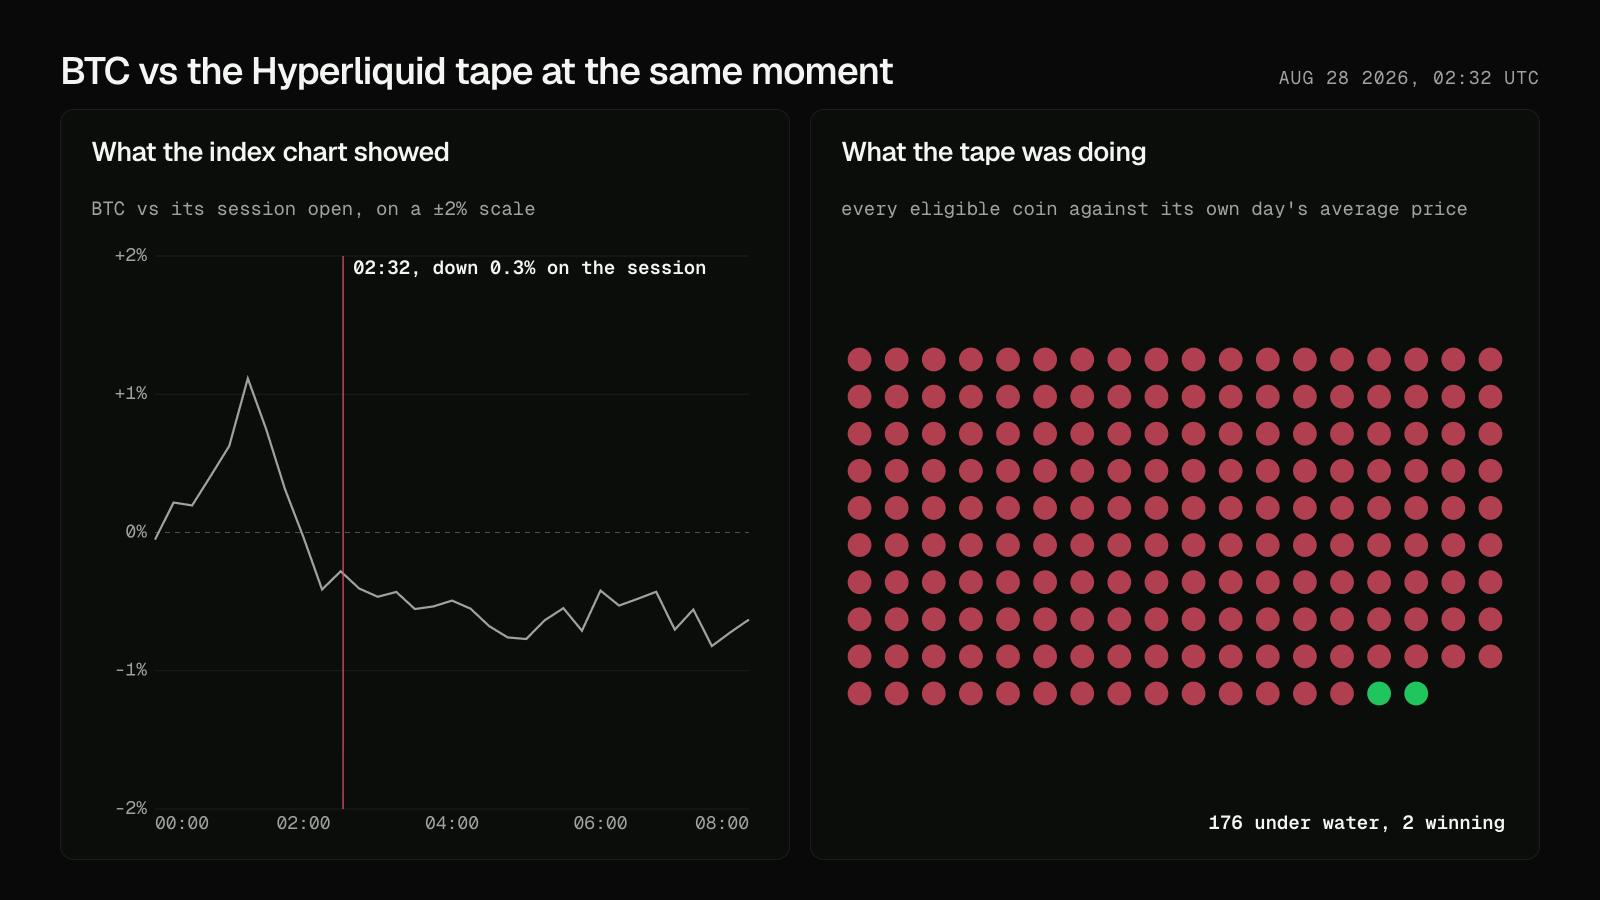
On August 28 at 02:32 UTC, Bitcoin had barely moved. 176 of 178 coins on Hyperliquid were under water.
What VWAP breadth measures
Every reading carries four numbers. One real minute of data, Aug 28 at 12:00 UTC, explains all of them.
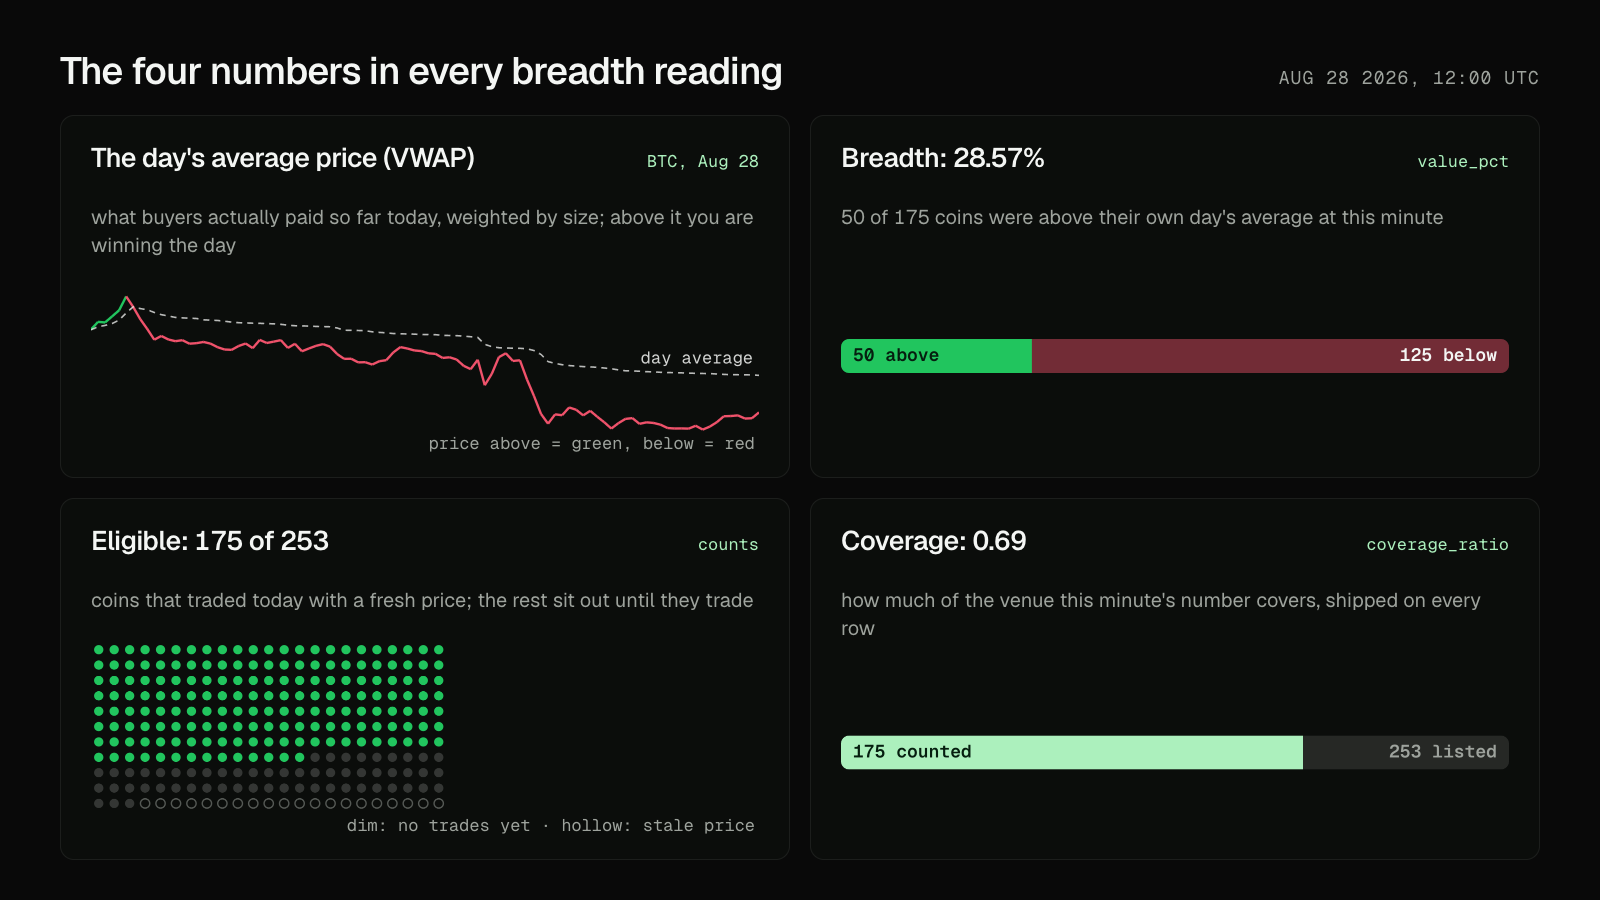
Every snapshot also carries the raw counts behind the percentage, so you can check the math yourself.
Why market breadth is an edge, and its first eight days on Hyperliquid
Every equities desk watches market breadth: count how much of the market confirms a move instead of trusting the index. The same count works in crypto, someone just has to keep score on hundreds of coins every minute. This endpoint keeps the score for Hyperliquid and serves it as one number.
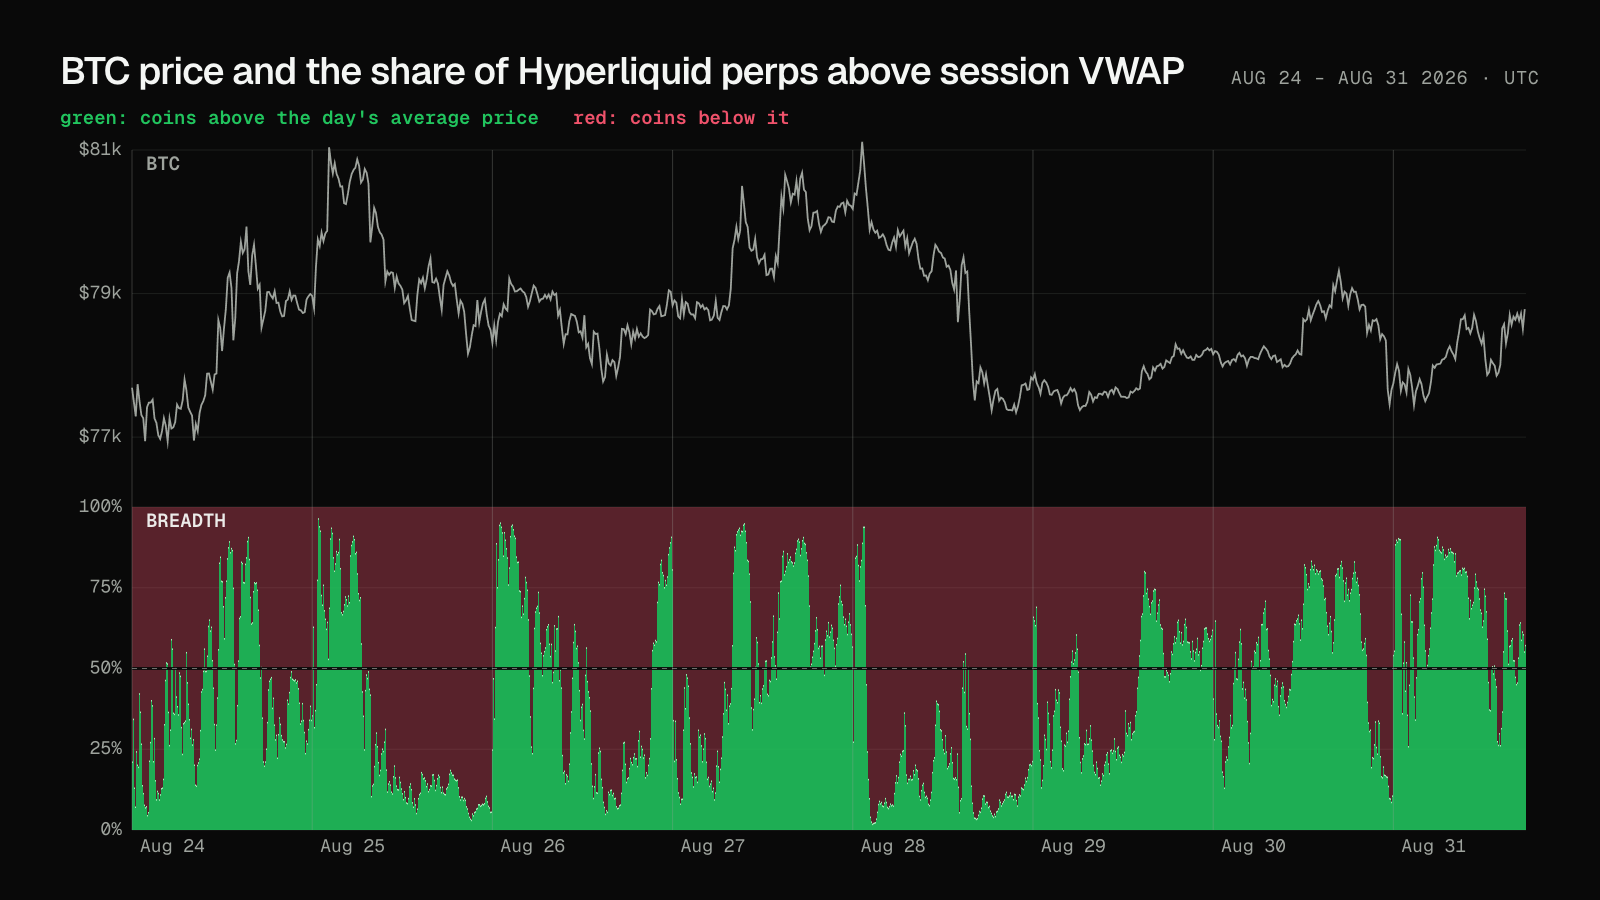
The VWAP anchor is why the count carries signal. A coin above its session VWAP is trading above the day's volume-weighted average price. Summed across the venue, that is a read on breadth: is the tape winning together, or are the majors dragging the index while everything else drowns? The first eight days on record, day by day:
| Day (UTC) | First | Low | High | Last |
|---|---|---|---|---|
| Aug 24 | 54.2% | 3.9% | 92.3% | 37.5% |
| Aug 25 | 21.9% | 1.7% | 97.8% | 6.1% |
| Aug 26 | 16.3% | 3.9% | 96.0% | 91.4% |
| Aug 27 | 48.2% | 5.6% | 95.6% | 59.3% |
| Aug 28 | 40.8% | 1.1% | 96.0% | 22.4% |
| Aug 29 | 45.0% | 11.4% | 81.6% | 63.1% |
| Aug 30 | 44.2% | 6.2% | 85.5% | 8.6% |
| Aug 31 (to 17:40) | 34.3% | 21.4% | 93.6% | 61.7% |
First and last are each day's first and last reading; the first minute of every day is empty by design (see the quirks section).
How breadth catches selloffs the BTC chart hides
The clearest early example of the Bitcoin chart and the rest of the market disagreeing. Bitcoin opened August 28 near its weekly high and slipped 0.64% overnight. Nothing you would wake up for.
Breadth told it differently. At 02:32 UTC, 176 of 178 coins were under water. Almost everyone long anything that night was losing while the BTC chart read flat.
What to know before you trade on it
Three things about how it behaves. Read them before wiring it into a strategy.
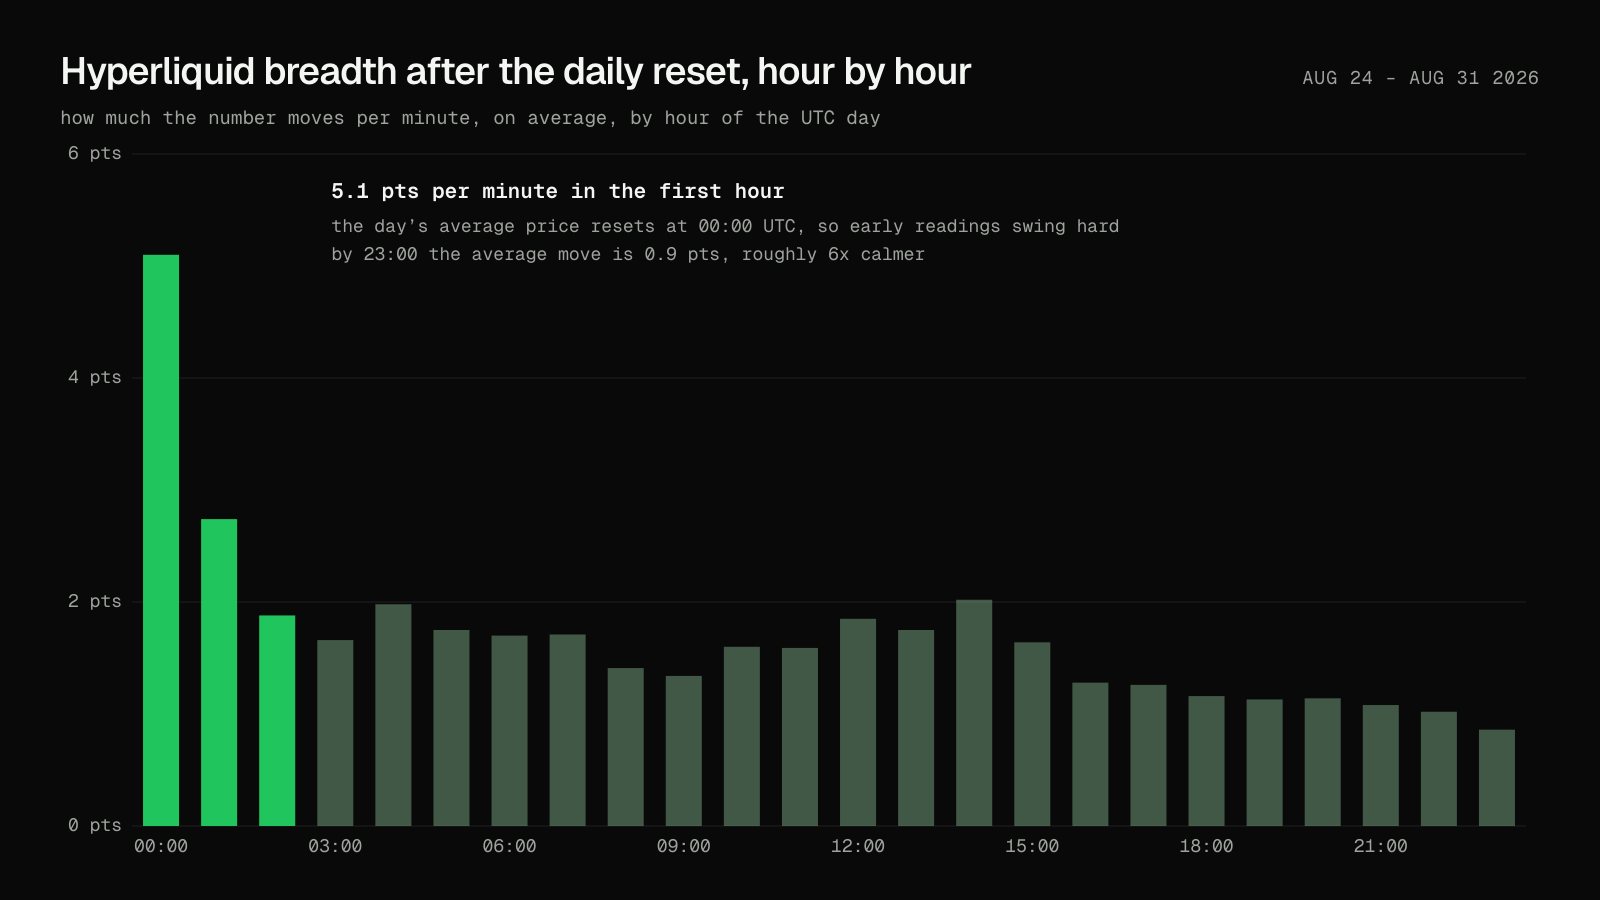
1. The day resets at 00:00 UTC, and the number goes wild for a few hours. A fresh day means a fresh average built on minutes of trading, so tiny moves flip coins from green to red. The first minute of each day is empty, nothing has traded yet. None of this is a market signal. It is just the clock.
2. Zoomed-out views show the last reading, never an average. Ask for interval=15m and each row is the final snapshot of its window. Averaging would mix readings that counted different coins.
3. The coin count breathes. Coins drop out when they go quiet or their price goes stale, and they come back when they trade again. Every row says exactly how many were counted and why the rest were not, so nothing shifts under you silently.
Calling the breadth endpoint: parameters and response
One route, key in the X-API-Key header. Omit interval for the raw one-minute snapshots; page through history with cursor from each response's meta.next_cursor.
| Param | Values | Behavior |
|---|---|---|
start / end | epoch ms, inclusive | window; defaults to the last 24h |
interval | 5m, 15m, 30m, 1h, 4h, 1d | zoom out; each row is the last reading of its window, omit for the raw minute feed |
limit | 1–1000, default 100 | rows per page |
cursor | from meta.next_cursor | pagination through long windows |
GET /v1/hyperliquid/breadth/above-vwap

{
  "session_date":  "2026-08-28",
  "calculated_at": "2026-08-28T12:00:00Z",
  "value_pct":      28.5714,
  "coverage_ratio": 0.6917,
  "counts": {
    "candidates": 253,  "eligible": 175,
    "above": 50,  "at": 0,  "below": 125,
    "excluded_no_session_volume": 58,
    "excluded_stale_price": 20
  }
}
Noon UTC on August 28, the session that set the recorded low: 50 of 175 above, 28.57%.
To put price next to breadth, the candles endpoint serves OHLCV for any Hyperliquid perp with the same auth and envelope; every BTC number in this article came from it. The rest of the venue's surfaces live on the Hyperliquid hub.
Run this analysis from an agent
Every number and chart in this article came from public endpoints an agent can call. 0xArchive ships an MCP server, so Claude and other AI agents can query the same breadth and candle surfaces in plain language. There is a Claude Code skill for terminal workflows and an agentic gateway for bounded data requests. Start with the agent surfaces overview or the guide to replayable market data for MCP, CLI and agent workflows.
The Midnight Reset research tests a session-based signal and reports its sample size and trading costs.
Route references
Use the market breadth reference for the breadth route and the Candles reference for the OHLCV that pairs price with it.
For current API availability and plan details, use the Hyperliquid data API, data catalog, pricing, and status.