
TreadFi routed $1.19B through 555 wallets, about $2.1M a wallet: a small number of large, coordinated accounts. Phantom routed $867M through 6,569 wallets, about $132K a wallet: the widest retail reach in Arrakis's HIP-3 study. Same rail, opposite crowd. The only way to tell them apart after the fact is order-level history with a wallet on every line, not a volume chart.
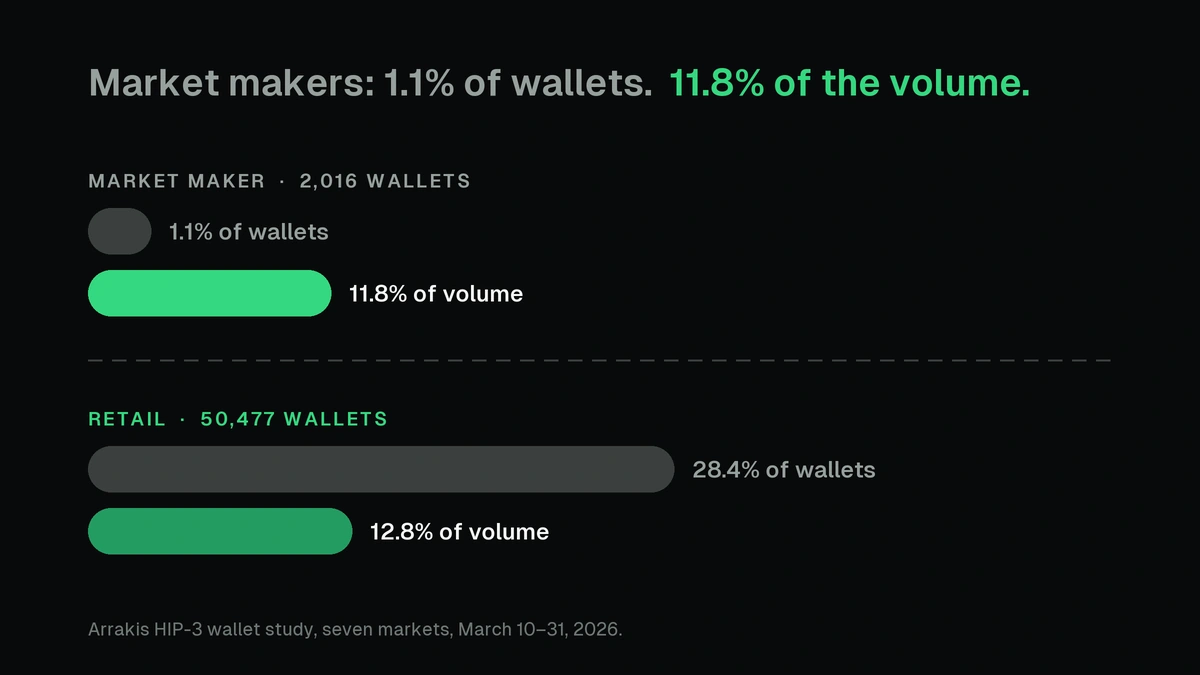
That distinction runs through the whole study. Market makers are 1.1% of wallets and 11.8% of the volume. Retail showed up as wallet breadth, not volume concentration: 28.4% of wallets, 12.8% of volume. Neither number comes from counting fills. Both come from tying wallet-attributed order rows across the three-week, seven-market window.
A pattern that only shows up over time
The sharpest finding in the study came from watching a market do nothing. Stat arb bots largely disappeared on weekends. Their edge depended on cross-venue price dislocations against CME, and once CME closed, there was nothing left to arb against. A live snapshot cannot show a strategy vanishing; it only shows what is trading at that moment. A three-week order-level record shows the absence because wallets and orders remain identifiable even when Saturday fills disappear.
What Arrakis built this on, and what we supplied
Arrakis published the study April 8, 2026, and credited 0xArchive and HyperTracker (by CoinMarketMan) for the data behind it. The window: seven builder markets, March 10 to 31, 2026, 808 million order lifecycle events. xyz_SILVER alone did $78.6B, more than the other three silver deployers combined. 209 wallets traded all four silver markets. Finding that group requires classification across markets.
Arrakis owns the labels and the interpretation. 0xArchive supplied the wallet-attributed fill and order rows used across the full three-week window before publication. The benchmark tests whether that record holds up on a rerun.
/wallets/classify precomputes the same behavioral fields a taxonomy like this depends on: cancel rate, maker ratio, order-to-trade ratio, one row per wallet per day. Pull it twice for the same date and the wallet metrics match exactly; only the request_id in the response changes. The benchmark covers the full method.
Pull the same shape of record
# fills for xyz:TSLA, 2026-06-30 to 07-01 UTC, wallet on every row
curl "https://api.0xarchive.io/v1/hyperliquid/hip3/trades/xyz:TSLA?start=1782777600000&end=1782864000000" \
  -H "X-API-Key: $OXARCHIVE_API_KEY"
Every row carries user_address. Pair it with /orders/{symbol}/history for order-level state (placed, open, canceled) on the same wallet. Every route, schema, and served depth is on every plan, including Free; Free history covers the most recent rolling 30 days with a maximum 30-day span per request, while Build and above keep the full retained archive. The 21-day Arrakis window fits a single request's span, but the March 2026 study dates now sit beyond Free's rolling window, so reproducing that exact window takes Build or above. Pulling a current fill-level slice needs nothing beyond a free key and cursor pagination through the trades route; the order-state and wallet-classification steps above are the rest of the reconstruction.
What the native API leaves out
None of this comes from Hyperliquid's own API at market scale. Its own docs cap userFillsByTime at the 10,000 most recent fills and historicalOrders at 2,000 most recent per user: enough for a live check on one wallet, not enough for a market-wide study. There's a raw S3 archive too, but it's L2 book snapshots only, updated roughly once a month with no guarantee of completeness, no order-level detail, and no wallet attribution at all. A study like this requires collecting and reconstructing three weeks of market state by hand before the wallet work can start. See the comparison for the route limits behind that workload.
Pull the same slice of history yourself: create a free account, or go deeper with the HIP-3 REST reference.